
Ask three people to work out the ROI of the same CX improvement and you can get three different answers. The formula is the easy part. The inputs are where the number is won or lost.
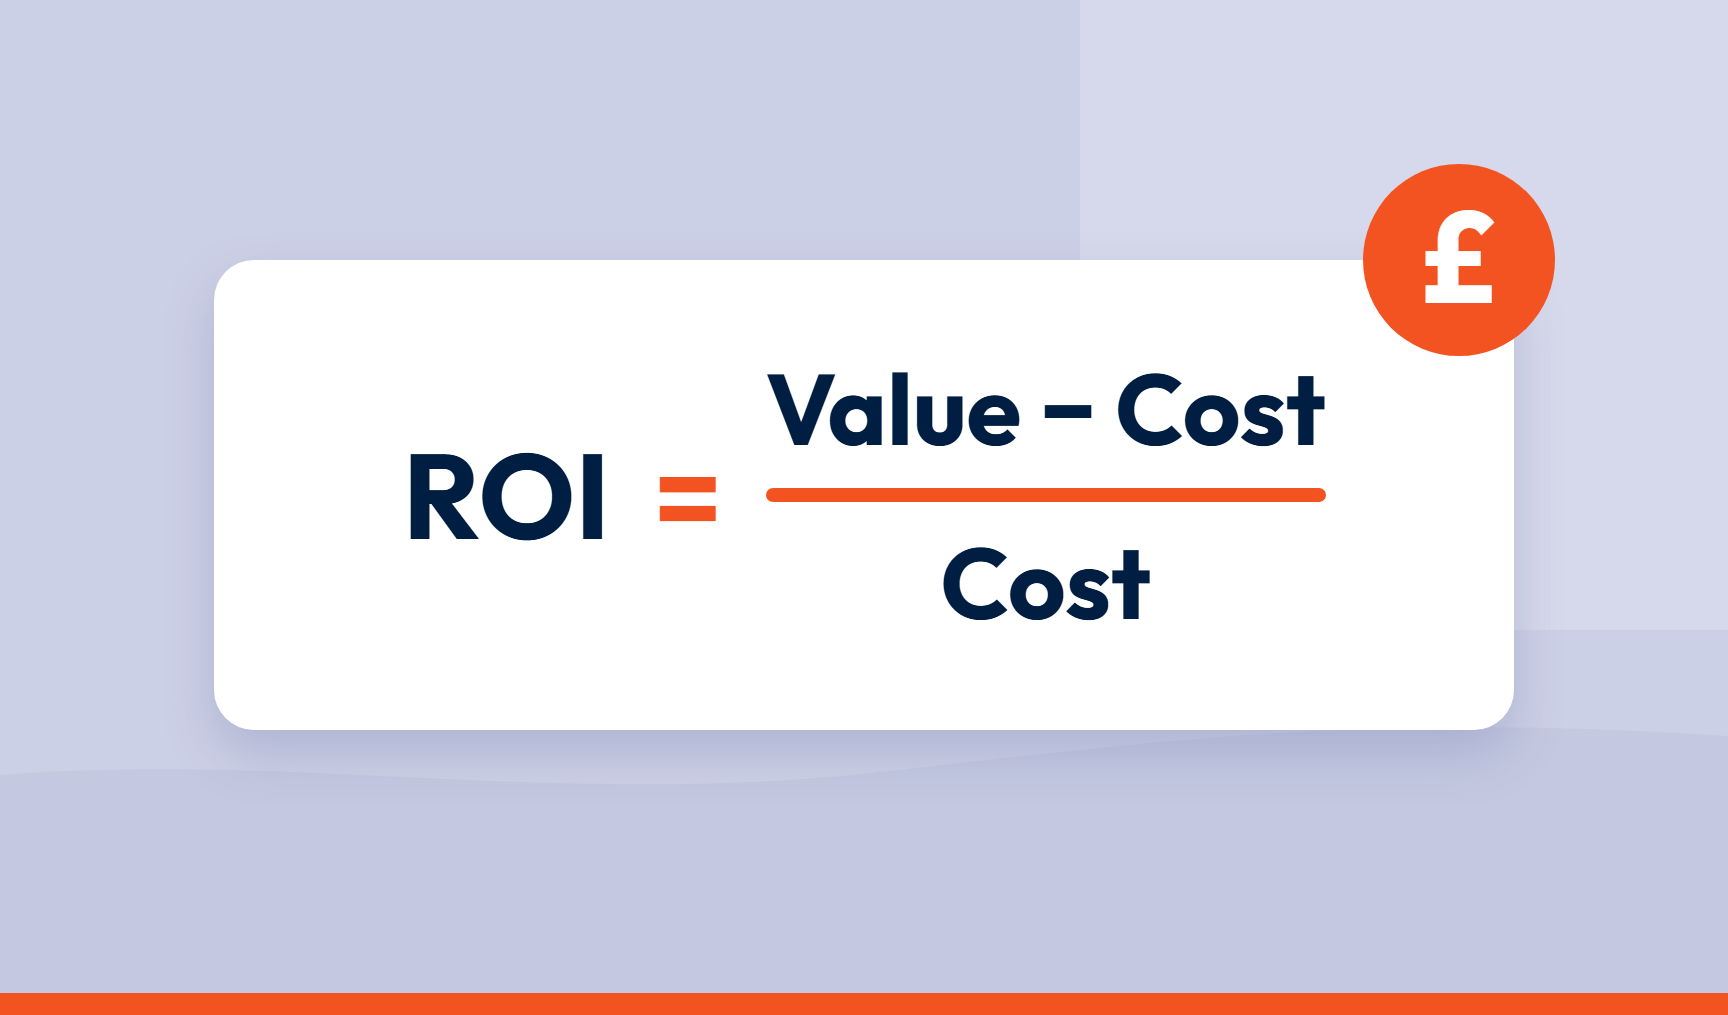
Customer experience ROI is calculated by subtracting the cost of an initiative from the financial value it generated, then dividing the result by the cost.
Key takeaways
- ROI (%) = (attributed financial value − cost) ÷ cost × 100.
- Include all the costs of delivering the initiative.
- Use the financial value of the benefit, not simply revenue generated.
- Use segment-level inputs where you can. Averages can overstate or understate the value.
- Count each underlying benefit once.
- Allow for the lag between an intervention and the benefits it produces.
- Attribute only the share of the change the evidence supports.
The CX ROI formula
ROI (%) = (attributed financial value − cost) ÷ cost × 100
- Cost is what you spent to deliver the initiative over the measurement period.
- Financial value is the economic benefit generated over that period, such as cost saved or margin retained.
- Attributed financial value is the share of that benefit you can fairly claim for the initiative. Attribution is simply how much of the change you can credit to it.
An initiative might generate £30,000 of financial value. If the evidence supports crediting 80% of the change to it, the figure used is £24,000.
An ROI of 100% means the attributed value was twice the cost: the business recovered its £1 and gained another £1. For where returns come from, see what customer experience ROI means.
A worked example
An online retailer finds that “where is my order” is its most common complaint topic. It starts sending proactive delivery updates. Every figure below is illustrative.
Step 1: Add up the cost
| Cost | Amount |
|---|---|
| Set-up and tooling | £14,000 |
| Team time (25 days at £280) | £7,000 |
| Training | £1,500 |
| Running costs (12 months) | £5,500 |
| Total cost | £28,000 |
Step 2: Value the cost-to-serve saving
Contacts about the topic fall from 30,000 a year to 18,000. That’s 12,000 avoided contacts.
Phone contacts and email or chat contacts don’t cost the same. Say a phone contact costs £6 and an email or chat contact costs £3. Between them that would be an average of £4.50.
The simple approach multiplies the avoided contacts by that average:
12,000 × £4.50 = £54,000
But the avoided contacts weren’t split half and half. A third were phone and two thirds were email or chat, so the average is the wrong yardstick. Splitting by channel gives the real saving:
| Channel | Contacts avoided | Cost each | Saving |
|---|---|---|---|
| Phone | 4,000 | £6.00 | £24,000 |
| Email and chat | 8,000 | £3.00 | £24,000 |
| Total | 12,000 | £48,000 |
The average overstated the saving by £6,000 (£54,000 minus £48,000). Use £48,000, because it reflects the contacts the initiative actually affected. Claim £54,000 and sooner or later someone asks where the extra £6,000 came from.
Step 3: Value the repeat-purchase gain
Of 20,000 customers whose orders were delayed, repeat purchases within 12 months rise from 38% to 41%. That’s three more repeat customers in every hundred, or 600 in total, each contributing £35 in margin, not revenue.
600 × £35 = £21,000
Observed financial value: £48,000 + £21,000 = £69,000. That’s the value associated with the changes. It isn’t necessarily all down to the initiative.
Step 4: Attribute the change
Some of the change may have happened anyway. Demand shifted with the season, or the courier fixed its own problems. If the courier sorted itself out that quarter, that isn’t your win.
Assume the retailer has evidence supporting 75% attribution to the delivery updates.
£69,000 × 75% = £51,750
The 75% is an assumption in this example, not a benchmark. In practice, base it on the evidence and method available. How to establish it is covered in how to prove customer experience drives revenue.
Step 5: Calculate the ROI
(£51,750 − £28,000) ÷ £28,000 × 100 = 84.8%
For every £1 invested, the initiative generated £1.85 in attributed value: a net gain of 85p after recovering the original £1.
Want a quick first estimate before you gather your own figures? SmartCX’s ROI calculator uses published industry benchmarks to give you a starting number. Treat it as a first estimate rather than a result. The five steps above, run on your own data, are what make a figure defensible.
Keeping the inputs honest
Two habits make a figure easier to defend:
- Use the financial value of the benefit, not revenue. Where the benefit is extra sales, use margin. Where it’s a saving, use the cost avoided.
- Use segment values where the initiative targets a specific group. If it affects customers with delayed deliveries, use that group’s behaviour and value, not the whole customer base.
Avoiding double-counting
A saving that appears twice in your spreadsheet is usually a mistake, not a miracle. Watch for three cases:
- One saving, two labels. An avoided repeat contact is a cost-to-serve saving. Don’t also count it as an efficiency gain.
- Revenue and margin. If margin is the value you’re using, don’t add the underlying revenue as well.
- Overlapping initiatives. If a new returns process and the delivery updates both cut the same contacts, split the saving between them rather than letting each claim all of it.
Every pound of value should have one place.
Allowing for the lag
Benefits land at different speeds. Contact savings can show up within weeks. Customers can’t repurchase on day three, so a repeat-purchase gain can’t show up on day three either.
Use a measurement period long enough to capture the behaviour and measure costs and benefits over the same window.
In the example, the contact saving alone, attributed at 75%, is £36,000. Against £28,000 of cost:
(£36,000 − £28,000) ÷ £28,000 × 100 = 28.6%
The repeat-purchase gain lifts the eventual ROI to 84.8%, but it isn’t visible yet. So, label an early figure as partial and update it as the slower benefits arrive.
Where the inputs come from
Costs and margin typically come from finance and project records. Volumes come from your feedback and contact data, cost per contact from operations, and customer behaviour from your CRM and order data. Before-and-after volumes only compare if the issue was counted the same way both times. If classification changes between periods, an apparent fall may reflect the analysis rather than a real change.
What you can do right now
Pick one improvement you’ve already shipped. Find the before-and-after volume for the issue it targeted, and the cost per contact by channel. Work through the five steps above for a first read.
How SmartCX helps
For CX leaders and managers who need to turn scattered feedback into decisions the business acts on, SmartCX gives every team one trusted data foundation for every dashboard, decision, action and AI workflow.
As a VoC platform, SmartCX collects and unifies your feedback, then tracks topic volumes over time, so the before-and-after figures in your calculation trace back to what customers said. Margin, customer value and cost data can stay where they are. SmartCX can connect your tech stack, so CX intelligence sits alongside them and you can see the CX ROI behind each initiative. See it in a product tour.
Frequently asked questions
How do you calculate customer experience ROI?
Subtract the initiative’s cost from its attributed financial value, divide by the cost, and multiply by 100. ROI (%) = (attributed financial value − cost) ÷ cost × 100.
Should I use average or segment values?
Use segment values where the initiative targets a particular group, issue or channel. Averages can include customers or cases the initiative never touched, which distorts the result.
Should I use revenue or margin?
Margin, not revenue, because revenue ignores what it cost to earn. Where the benefit is a saving, use the cost avoided.
How do I avoid double-counting benefits?
Count each underlying benefit once. Don’t count one saving under two categories, add revenue to the margin it produced, or let overlapping initiatives each claim the full benefit.
What time period should I use?
One long enough to capture the relevant customer behaviour, such as a purchase or renewal cycle. Measure costs and benefits over the same period.
Can I estimate ROI before all the benefits have landed?
Yes. Calculate an early, partial ROI from the benefits that have already appeared, label it clearly, and update it as slower benefits arrive.
Want to see how it works? Watch a tour or talk to us.