
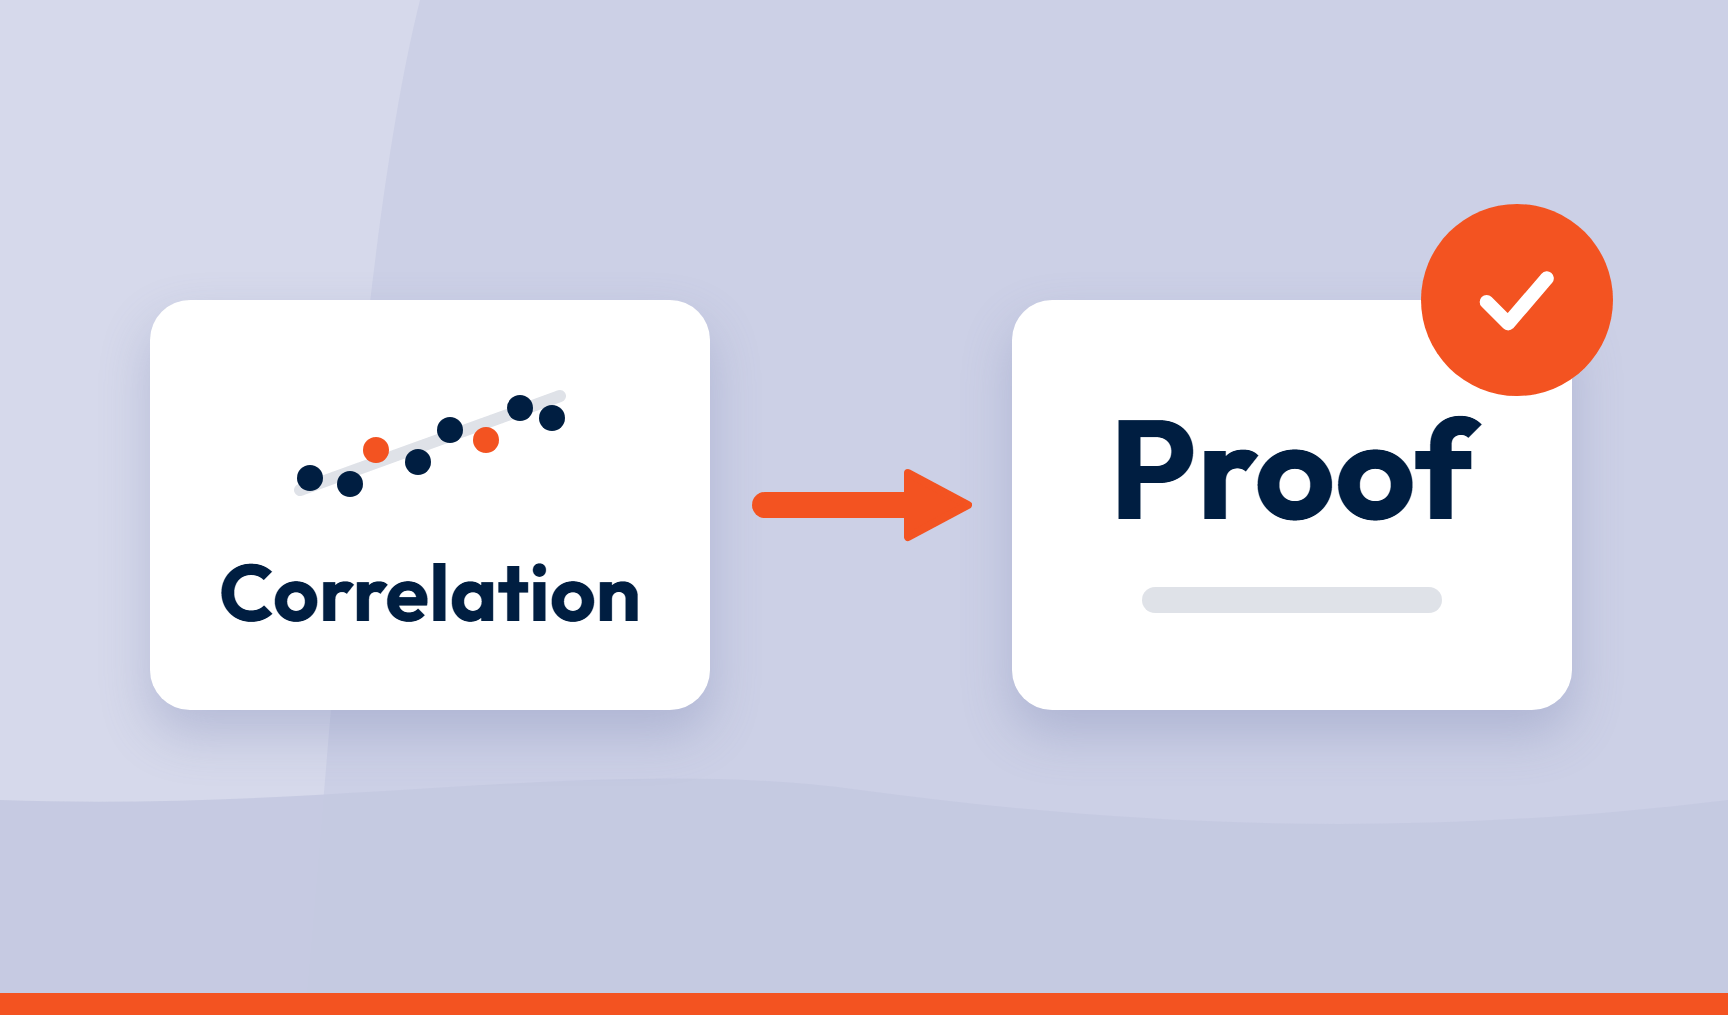
Revenue rose after the new returns process went live. It also rose after the spring promotion, the price change and a competitor’s outage. Which one gets the credit?
To make a credible case that customer experience drives revenue, you need to show that customers who had a better experience went on to spend, stay or buy more, while accounting for the other factors that could explain the difference. That takes three things: feedback tied to individual customers, a comparison that shows what would have happened anyway, and analysis someone can trace back to what customers actually said.
Key takeaways
- A credible case shows that the experience came first, behaviour changed afterwards, and other plausible explanations have been accounted for.
- Correlation is a starting point. Happier customers may already be your most valuable ones.
- Link survey responses to CRM and finance records customer by customer, using a shared customer ID.
- Pre/post comparisons, cohorts, control groups and holdouts each give a different level of confidence.
- Analysis you can trace to the verbatim is easier to defend than black-box analysis.
- Aim for a defensible estimate, not certainty.
Correlation is where proof starts, not where it ends
Customers who give high scores tend to spend more. Useful to know, but it doesn’t show the experience caused the spending.
Take a bank. Customers who use its app have higher retention. Does the app keep them, or are engaged customers more likely to download it? Both can be true. Without a way to separate them, you’d credit the app with loyalty that was already there.
Three traps catch most attempts:
- Reverse causation. Spending more may lead to better service, not the other way round.
- Hidden third factors. Tenure, product type or customer size can drive both satisfaction and spend.
- Self-selection. The customers who answer surveys may differ from those who don’t.
Proof is the work of ruling these out, one at a time.
Link survey data to customer records
An average satisfaction score set beside total revenue can’t tell you whether one caused the other. A survey response tied to the customer who gave it, and to what they did next, can.
The building blocks are:
- the survey response (score, comment and date)
- contact and ticket history
- orders, renewals or cancellations
- margin or revenue per customer
Join them on a shared customer ID. SmartCX enriches every response with context such as customer ID, channel and location, and integrates with your CRM so it can sit beside the records that show what customers did afterwards.
Three snags are worth planning for:
- Unmatched responses. Anonymous responses can’t be linked, so the share that carry an ID caps everything else you can show.
- Timing. Compare behaviour after the response date. Behaviour before it can’t have been caused by it.
- Who answered. Survey respondents are only a subset of your customers. Check whether they differ from the wider base before generalising from the results.
Handle the linked data in line with your consent and data protection obligations.
Four ways to isolate the effect of CX
Each of these answers the same question: what would have happened without the change?
| Method | What it compares | Works best when | Watch out for |
|---|---|---|---|
| Pre/post | The business, or the same customers, before and after a change | You can’t hold anyone back and the effect shows quickly | Seasonality, promotions and anything else that moved in the same period |
| Cohorts | Groups by experience, such as customers who hit a problem and those who didn’t | You want to see how behaviour diverges over time | Groups that differ in other ways, so the gap may not come from the experience |
| Control group | Customers who didn’t get the change, matched to those who did | The rollout is staggered or limited to some regions or channels | Poor matching, or controls that differ systematically |
| Holdout | A randomly chosen group kept on the old experience for a set period | You’re improving something rather than fixing harm, and can delay for some | Fairness, practicality and needing enough customers to see a difference |
Pre/post is usually the weakest on its own, because anything that changed at the same time muddies the result. A well-designed holdout can provide the strongest evidence, because random selection helps remove many of the hidden factors. In between sit cohorts and control groups, which are often what you can realistically run.
A staggered rollout gives you a comparison group without withholding anything permanently. The regions that go live last can serve as the baseline for those that go first, provided the groups are sufficiently comparable.
The strongest evidence often comes from more than one method. A holdout can provide the headline result, while cohorts show which customers moved.
Analysis you can defend
A number is only as believable as the analysis beneath it. When someone challenges it, you need to be able to show your working.
Say your analysis finds that customers who mention repeating themselves to support are more likely to leave. That’s a strong claim. It stands up only if you can pull up those customers and show their own words. If the analysis came from a black box, you can’t.
Two things make analysis defensible:
- Traceability. Every number should trace back to the verbatim behind it. Key driver analysis ranks topics by impact, so you know where to look, and the comments show why.
- Consistency. Topics are discovered automatically and classified the same way across every source and every period, so a before-and-after comparison is like for like. Because the analysis is stored, you can compare historical data using the same structure rather than relying on a new interpretation of the same feedback each time.
Journey-based feedback adds another layer. Gather feedback at each stage and you can see where a problem sits in the journey, and whether customers who experienced it behaved differently afterwards.
What the evidence can and can’t tell you
Even a well-run holdout leaves some uncertainty. Customer numbers are finite, behaviour is noisy and some effects take months to arrive.
So, report it honestly: the size of the difference, how confident you are, and what you couldn’t rule out. A claim that admits its limits is harder to knock down than one that doesn’t.
The output of all this is the share of a change you can credibly attribute to the initiative. That figure feeds the attribution step in how to calculate customer experience ROI.
What you can do right now
Take your most recent survey and check what share of responses carry a customer ID that matches a record in your CRM. That figure sets the ceiling on everything above. If it’s low, fixing it comes before any analysis.
How SmartCX helps
For CX leaders and managers who need to turn scattered feedback into decisions the business acts on, SmartCX gives every team one trusted data foundation for every dashboard, decision, action and AI workflow.
SmartCX, a VoC platform, brings feedback from surveys, reviews, support tickets and social into one place. Because it connects with your existing tech stack, including CRM and BI tools, CX intelligence can sit alongside the revenue, churn and other outcome data you’re testing it against. That gives CX teams a structured foundation to measure CX impact, with evidence behind every finding. See it in a product tour.
Frequently asked questions
Is correlation enough to prove CX drives revenue?
No. Correlation shows that two things move together. It doesn’t show that one caused the other, because other factors may drive both. You need a comparison that shows what would have happened without the experience change.
Can you run a control group in CX?
Often, yes. A staggered rollout creates one naturally, with later regions or channels acting as the comparison for those that go first. Otherwise, you can match customers who didn’t receive the change to those who did, on factors such as tenure, product and segment.
How do I connect survey data to CRM data?
Use a shared customer ID. Link each survey response to the customer record, then bring in what that customer did afterwards, such as renewals, orders and cost to serve. Responses without an ID can’t be linked, so aim to capture one at collection.
What if I can’t run a holdout?
Use a staggered rollout, a matched control group or cohorts instead. Where none is possible, compare before and after against the same period in earlier years to allow for seasonality, and say plainly that the result is weaker evidence.
Why does black-box analysis weaken the case?
Because you can’t show where it came from. If someone asks why a topic matters, you need to drill down to the customers and comments behind it. Analysis that can’t be traced is hard to defend.
Want to see how it works? Watch a tour or talk to us.