
Ask for the evidence that CX pays off and you’ll often be handed a statistic with no year and no source. This page gives each one its source, its date and its limits.
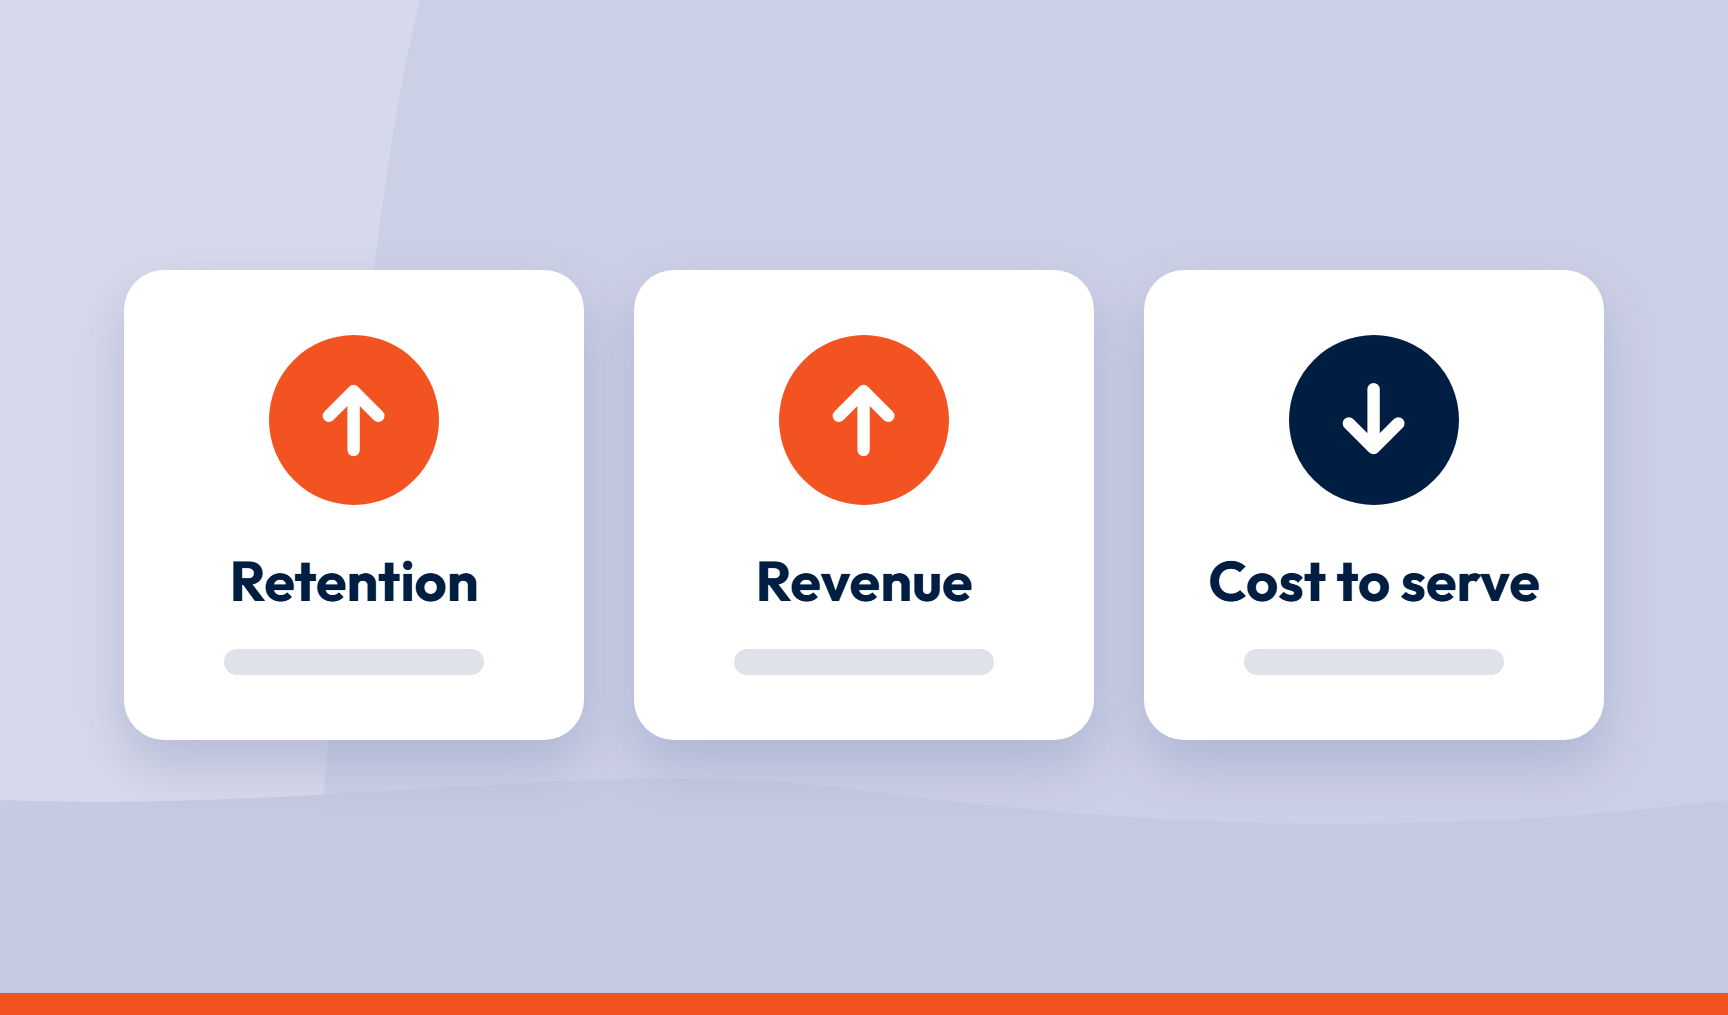
The evidence points in the same direction. Keeping customers costs less than finding new ones. Customers with better experiences spend more. Bad experiences push people away. And a significant share of service demand comes from problems that could be fixed. Together, that makes the case for tackling root causes rather than patching symptoms.
Key takeaways
- Better experiences are consistently associated with higher retention, higher spend and lower cost to serve.
- Much of the evidence is correlational, and most of the figures are over a decade old. Each is dated below.
- Acquiring a customer costs five to 25 times more than keeping one, according to Harvard Business Review.
- Two analyses link experience to revenue: customers with the best past experiences spent 140% more in one regression analysis, and a seven-point rise in NPS was associated with about 1% more growth in a UK study.
- Industry and public-sector studies put avoidable contact at roughly a quarter to a third of demand.
- The numbers support fixing root causes, not just resolving individual cases.
At a glance
| Statistic | Source and year | Type of evidence |
|---|---|---|
| Acquiring a customer costs five to 25 times more than retaining one | Harvard Business Review, 2014 | Cited range |
| A 5% rise in retention can lift profits by 25% to 95% | Bain & Company, cited by HBR, 2014 | Cited research |
| 52% stopped buying from a brand after a bad experience with its products or services; 29% after poor customer experience | PwC, 2025 | Survey, reported behaviour |
| Best past experiences: 140% more spend | Harvard Business Review, 2014 | Regression analysis, two businesses |
| Seven-point NPS rise: 1% more sales growth | London School of Economics, 2005 | Correlation |
| Food retailers one point above sector satisfaction: 5.8% vs 2.9% annual sales growth since 2019 | Institute of Customer Service, 2024 | Sector-level association |
| About 35% of HMRC calls avoidable | National Audit Office, 2010 | Public-sector estimate |
| 27% of contact centre contacts avoidable, on average | Customer Contact Association and Sabio, 2012 | Contact-centre survey |
| Churn down 10 to 25 basis points for companies acting on journey insights | McKinsey, 2013 | Consultancy analysis |
| 80% of firms say they deliver a superior experience; 8% of customers agree | Bain & Company, 2005 | Survey |
A note on the numbers
A statistic without a year is a rumour. Every figure here has one, and most date from between 2005 and 2018, so read them as historical evidence rather than current benchmarks. Most come from surveys and observational studies, so they show that two things go together, not that one caused the other. How to test that in your own business is covered in how to prove customer experience drives revenue.
Retention and churn
Acquiring a customer costs five to 25 times more than retaining one (Harvard Business Review, 2014). HBR’s own wording is that the multiple depends on which study you believe and which industry you’re in. Treat it as a range, not a rule.
A 5% rise in retention can lift profits by 25% to 95% (Bain & Company research, cited in the same HBR article). The spread is wide because cost structures differ by industry, and the research is older than most people assume.
52% of US consumers say they stopped using or buying from a brand after a bad experience with its products or services, and 29% after poor customer experience (PwC, 2025, 5,511 US consumers). This is what people report having done rather than measured behaviour, and the sample is American. It still shows how little goodwill a repeated failure may have left to spend.
Companies acting on journey insights saw a 15% to 20% reduction in repeat service visits, a 10% to 20% boost in cross-selling and a fall of 10 to 25 basis points in churn (McKinsey, 2013). A basis point is a hundredth of a percentage point, so the churn fall is 0.1 to 0.25 points. It’s McKinsey’s own analysis of its client work and doesn’t set out the method, so read it as indicative.
One European energy company found that customers changing address accounted for 30% to 40% of its churn, and reported that clearer communications and an easy online set-up cut churn by 40% (McKinsey, 2013, same article). The company isn’t named, and the article doesn’t say whether the 40% applies to all churn or just the moving journey. It’s a single case, but it shows root-cause work in practice: the problem was found in the data, traced to one journey and fixed there.
Worked example (illustrative). A subscription business has 10,000 customers and keeps 80% each year. If retention rises to 85%, 500 more customers stay. If each contributes £300 a year in margin, that’s £150,000 in retained margin, before the cost of whatever raised retention.
Worked example (illustrative). A business with 100,000 customers and £300 a year in margin per customer sees churn fall by McKinsey’s range of 10 to 25 basis points. That keeps 100 to 250 more customers, worth £30,000 to £75,000 a year. Small percentages add up at scale, but the saving depends on what the fix cost and whether it caused the fall.
Customer value and revenue
Customers with the best past experiences spent 140% more in the following year than those with the poorest (Harvard Business Review, 2014). The analysis used experience and revenue data from two global businesses with revenues over $1 billion, one transactional and one subscription, covering more than half a million customers between them. The 140% figure comes from the transactional business. The authors used regression to control for other drivers of repeat purchase, which makes it stronger evidence than a simple correlation. It’s still based on two businesses and may not transfer directly to yours.
A seven-point increase in NPS was associated with a 1% increase in sales growth (Marsden, Samson and Upton, London School of Economics, 2005). The study compared recommendation scores from a telephone survey of 1,256 UK consumers with sales growth across retail banks, car makers, mobile networks and supermarkets. It was published in a trade magazine rather than a peer-reviewed journal, and the scores were compared with growth in preceding years. The findings show an association, not that raising NPS causes growth.
Consumers said they’d pay up to a 16% price premium for a great experience (PwC, 2017/18). Another stated-intention figure. It measures willingness to pay, not what people actually pay.
Since 2019, food retailers with a UKCSI score at least one point above the sector average achieved annual average sales growth of 5.8%, against a market average of 2.9% (Institute of Customer Service, UKCSI July 2024, as reported by the Evening Standard). It’s a sector-level association, and the Institute itself describes higher satisfaction as correlating with financial stability and growth rather than causing it. Pricing, range and store estate all move at the same time.
Cost to serve
HM Revenue & Customs estimated that around 35% of calls to its contact centres were avoidable (National Audit Office, 2010). The NAO put the cost of avoidable contact at up to £75 million a year, while noting the true figure was likely lower because avoidable calls tend to be shorter. It recommended capturing the root causes of why customers call, and reviewing end-to-end processes to cut the number of contacts per transaction.
UK contact centres reported on average that 27% of contacts were unnecessary or avoidable, with some reporting as many as 40% (Customer Contact Association and Sabio, 2012). The research put the cost at around £6.75 million a year for a typical UK contact centre. The most common categories were chasing calls from customers unsure what happens next, calls caused by poor outbound communication, and failures by the contact centre itself. Its definition of “unnecessary” also covered contacts that could move to self-service, so not all of it is failure demand.
Unhappy customers cost more to serve (Harvard Business Review, 2014). The authors note they’re more likely to return products and more likely to need support.
Worked example (illustrative). A contact centre handles 100,000 contacts a year at an average £4 each. If 27% are avoidable, that’s 27,000 contacts and £108,000 in handling cost. A root-cause fix rarely removes all of them. If it removes a third, the saving is £36,000 a year. Turning that into a defensible return is covered in how to calculate customer experience ROI.
The experience gap
80% of 362 companies surveyed believed they delivered a “superior experience”. Customers rated only 8% of companies that way (Bain & Company, 2005). It’s an old survey, but the gap illustrates a problem CX teams still face: a company’s view of its own experience can differ a long way from its customers’ view.
Why the numbers favour fixing root causes
None of these studies tests directly whether closing the insight-to-action gap lifts returns. What they show is what an open gap costs: repeat churn, repeat contacts and repeat failure. Fixing the cause is how a business stops paying that cost again. The McKinsey figures come closest, because they describe companies acting on what they learned, though they’re a consultancy’s own analysis rather than a controlled test.
The pattern is repeat and avoidable failure. Customers leave after bad experiences, spend less when experiences are poor, and contact businesses about problems that shouldn’t have happened. In the contact-centre research, the largest categories were chasing calls, unclear communication and the organisation’s own errors. Each has a cause that can be found and removed.
Resolving each case (the inner loop) protects one relationship. Fixing the cause (the outer loop) removes the problem for everyone who would have met it next.
The NAO’s advice to HMRC was to capture the root causes of contact and review end-to-end processes. It’s the kind of work that can turn a CX insight into a measurable business outcome.
What you can do right now
Pull your last quarter’s top ten contact reasons. Mark the ones caused by something the business could fix. That’s your own avoidable-contact figure, and it’s worth more than any benchmark on this page.
How SmartCX helps
For CX leaders and managers who need to turn scattered feedback into decisions the business acts on, SmartCX gives every team one trusted data foundation for every dashboard, decision, action and AI workflow.
SmartCX, a VoC platform, brings feedback from surveys, reviews, support tickets and social into one place and discovers topics automatically, so recurring problems surface across every source. Key driver analysis ranks them by impact, and every topic drills down to the verbatim. That’s the CX intelligence teams need to find a root cause. They can then act on feedback by routing issues to the people who can fix them, and track what changes over time to prove impact. It’s how SmartCX helps close the insight-to-action gap.
If you want a quick first estimate before your own data is ready, try the ROI calculator. See it in a product tour.
Frequently asked questions
How much more does it cost to acquire a customer than to keep one?
Harvard Business Review (2014) puts it at five to 25 times more, depending on the study and the industry. Treat it as a range rather than a fixed ratio.
Do customers with better experiences spend more?
In one analysis, yes. Harvard Business Review (2014) reported that customers with the best past experiences spent 140% more in the following year than those with the poorest at a transactional business, using regression to control for other drivers of repeat purchase. The analysis covered two businesses, so the result may differ in yours.
Does a higher NPS lead to higher revenue?
In one UK study, a seven-point rise in NPS was associated with a 1% increase in sales growth (London School of Economics, 2005). That was an association across four sectors, so it doesn’t show that raising NPS causes growth.
How many customers leave after a bad experience?
In PwC’s 2025 survey of 5,511 US consumers, 52% said they’d stopped using or buying from a brand after a bad experience with its products or services, and 29% after poor customer experience. That’s self-reported, so actual behaviour may differ.
How much customer contact is avoidable?
The estimates range from roughly a quarter to a third. HMRC estimated around 35% of calls were avoidable (National Audit Office, 2010), and UK contact centres reported an average of 27% (Customer Contact Association and Sabio, 2012). Both are dated, and definitions vary.
How reliable are CX ROI statistics?
Treat them as directional. Most are surveys or observational studies, many are over a decade old, and they show association more than cause. They’re best used alongside evidence from your own customers.
Want to see how it works? Watch a tour or talk to us.