
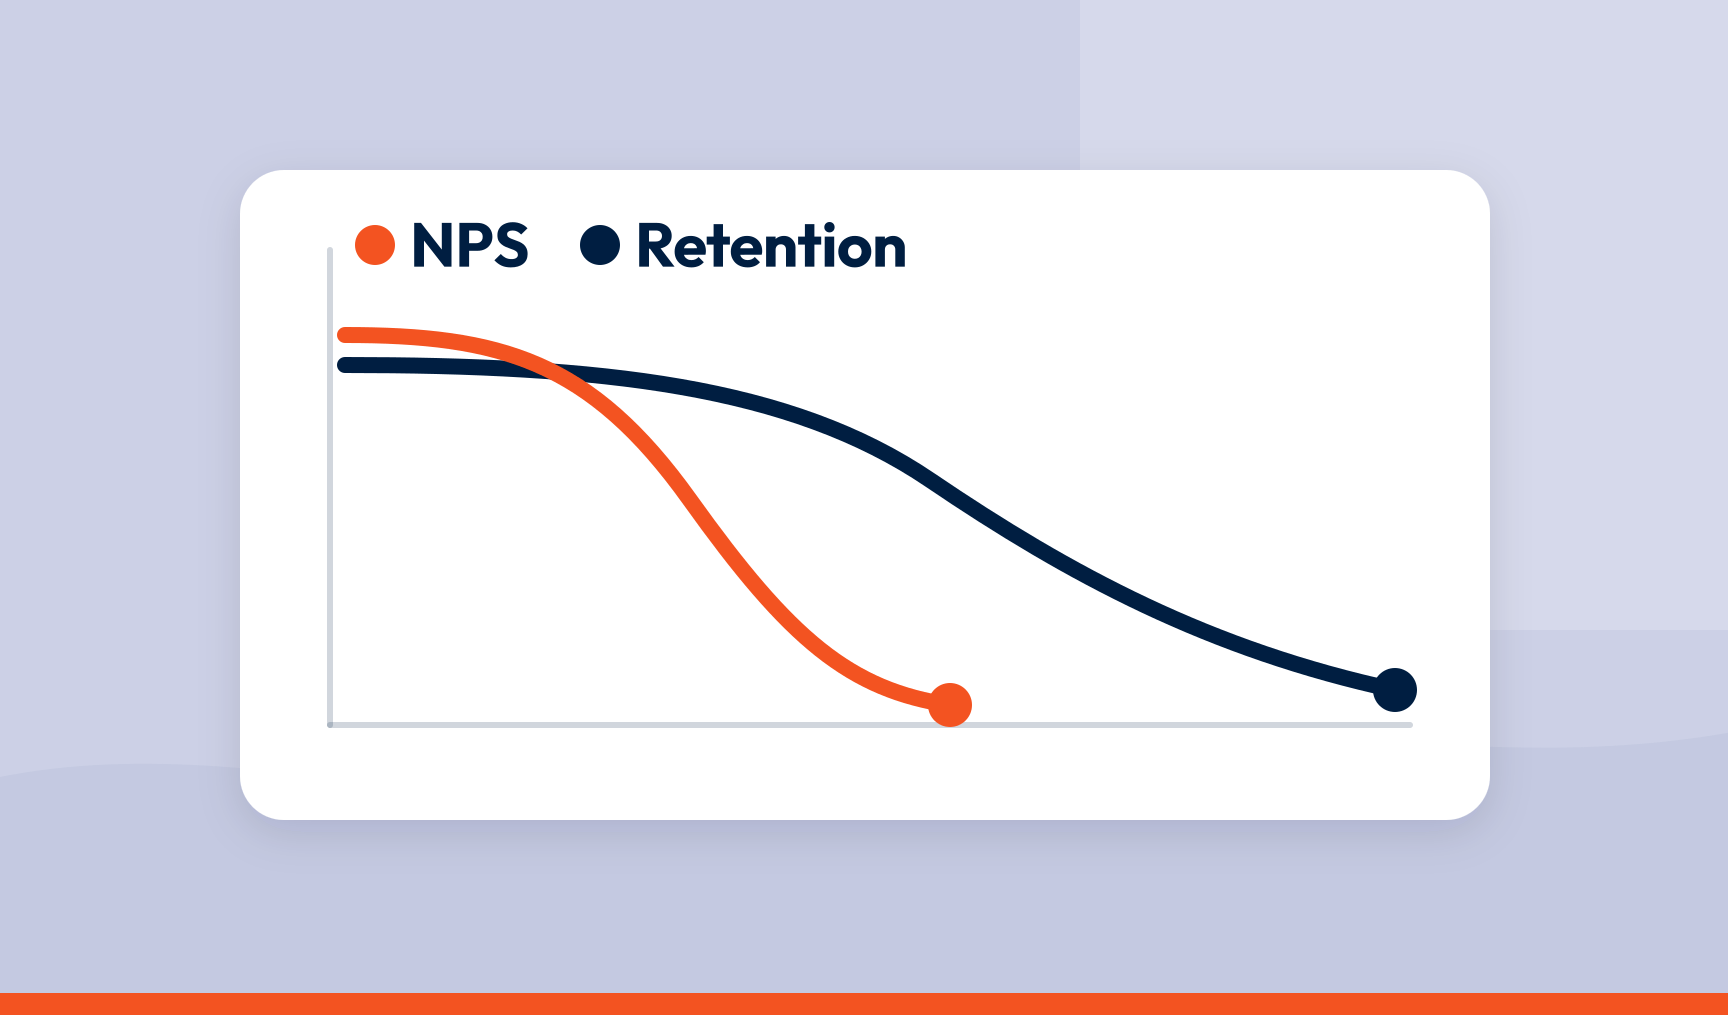
NPS predicts retention when you track it person by person, read the drivers behind the score, and act on both before anyone leaves. A company-wide score can’t do that. A score joined to the customer record and the reason the customer gave can, and that is the difference between a number you report and a warning you can act on.
Key takeaways
- A company-wide NPS tells you almost nothing about who is about to leave. An individual score with the reason attached tells you a lot
- Detractors are the visible risk. Passives are the silent one, and they are usually the bigger pool
- Everyone who gave you a score stands for several who felt the same and didn’t
- Rescue the person in front of you, then fix the cause so the next hundred never need rescuing
- Revenue at risk is the number that gets retention work funded
A customer scores you a 4 in March. Nothing happens. In September they don’t buy again, and your team is surprised.
That surprise is the whole problem. The warning was there six months earlier, sitting in a system nobody who could have acted on it looks at. Closing that gap is what turns NPS from a retention statistic into a retention tool.
Why NPS alone won’t tell you who is about to churn
Your company-wide NPS is like a mood ring. It changes colour, everyone stares at it, and nobody can tell you why. An NPS of 42 means promoters outnumber detractors by 42 points. That’s it. More people like you than don’t. It does not say who is about to leave, or what they would have needed from you to stay.
There is a school of thought that goes further and says NPS doesn’t predict retention at all. The question asks whether you would recommend, not whether you will renew, and plenty of promoters churn for reasons that have nothing to do with the experience: budgets get cut, champions leave, companies get acquired.
Fair, as far as it goes. But the headline number was never the useful bit. NPS predicts churn when three conditions hold.
- It is tracked individually, over time, so a drop shows up as a drop
- The reason is attached, because a 4 about pricing and a 4 about a broken integration are two different risks
- It is read alongside behaviour: purchase frequency, usage, support contacts, renewal dates where you have them
Meet those conditions and NPS stops being a scoreboard and becomes a leading indicator of retention.
What the score tells you about retention, segment by segment
The three NPS bands are not equally at risk, and they don’t need the same response.
Detractors: the visible risk
Detractors leave faster, phone more, and tell people. Bain & Company estimates a 3x to 8x gap in lifetime value between promoters and detractors, and the direct churn is often the smallest part of a detractor’s cost once you add support load and lost referrals.
The upside is that detractors have told you. Someone who scores you a 2 and writes three paragraphs is still in the conversation. Silence is worse.
Passives: the silent risk
Passives rarely complain, seldom write much, and quietly take the competitor’s call. When they leave it is a surprise, because nothing in the data screamed. This band is usually your largest and your most ignored. If you have to choose one segment to understand better this quarter, choose the 7s and 8s.
Promoters: the retention you already have
Promoters tell you what is working. That matters for retention in two ways. First, what they praise is what you must not break. Second, what they praise is what you should do more of, because a compliment is rarer than a complaint. One customer who takes the time to say the onboarding was excellent is standing in for many who thought so and said nothing.
The people who didn’t answer
Here is the assumption most retention models get wrong. They treat the respondents as the population. They are a sample, and a skewed one.
People complain quickly and compliment slowly. For every detractor who wrote about a billing error, several hit the same error, said nothing, and are now evaluating alternatives. The same is true in reverse: the promoter who praised your support team speaks for a crowd of quietly satisfied customers.
So when you size retention risk, do not count detractors. Count the driver. If 60 people scored you low and 40 of them cited the same checkout problem, the exposure is everyone who uses that checkout, not the 40 who wrote in.
A framework for connecting NPS to retention
1. Join every response to the customer record
A score without a person behind it is trivia. Attach the ID, their value to you, how long they have been with you, what they buy and where they gave the feedback to every response at the point of collection, pulled from your CRM, loyalty or billing system as metadata. Now a 4 is not a data point. It is a named customer worth £48,000 a year, or one who has bought from you every week for six years.
2. Segment by NPS band and by value
Lay the three NPS bands over your value tiers. A detractor worth £500,000 a year and one worth £50 are both detractors and they are not the same problem. This turns a score into a ranked list, and the top of the list is where your team starts on Monday.
3. Find the drivers behind each band
Read what each segment actually said. Key driver analysis ranks the themes by how much they move the score, weighted by how many said it and how strongly. Detractors clustering on ‘response times’ is a different retention problem from detractors clustering on ‘price’, and only one of them is fixable by the CX team.
Do the same for promoters. Their drivers are your retention assets.
4. Put a number on the revenue at risk
Map detractors to their annual value and historical churn rates. 500 detractors at £6,000 with 30% churn is £900,000 walking out, and that is before you widen it to everyone exposed to the same driver. Revenue at risk is the number that gets retention work funded. It is more persuasive than any upside you can promise.
5. Run both loops
Rescue the person in front of you: a valuable customer scores a 3, the case reaches someone who can fix it the same day with the comment attached, and they act on it. Then fix the cause behind it, so the next hundred never score a 3 for the same reason. Catching customers as they fall is necessary. Stopping them falling is where retention moves.
6. Watch the movement, not the schedule
A score that drops from 8 to 4 between two surveys is a signal. A driver turning negative among your most valuable customers is a louder one. These need to reach whoever owns the fix the week they happen. A quarterly review is where you find out about the customers you already lost.
Where the evidence needs to live
Retention is a team sport, and the team does not log in to the CX platform. Your account managers and service teams live in the CRM and the ticketing tool, so the score, driver and comment belong there, against the customer and with a case number. Leadership lives in the BI layer, so detractor rate, driver trend and churn by cohort belong side by side in Power BI or the built-in dashboard.
That is CX intelligence doing its job for retention: one set of feedback, delivered to the people who own the relationship, where they already work. And when the quarter ends, the driver you fixed, the detractor rate that fell and the churn line that followed are on one page, which is how you prove impact without an argument.
Mistakes that turn NPS into a vanity metric
Reading only the headline number
A company-wide score up two points can hide your most valuable customers sliding into detractor territory. Segment or don’t bother.
Ignoring the comments
The score tells you there is a problem. The words tell you what it is. Teams that analyse the number and skip the text have thrown away the only part that explains anything.
Surveying only when it suits you
Relationship NPS once a year is a photograph of last year. Add transactional feedback at the moments that matter, such as a first purchase, a support contact, a checkout or a renewal, so the warning arrives while there is still time to act. Collecting feedback across the journey is what turns NPS from an annual verdict into a continuous signal.
From score to retention
NPS was never designed to be reported. It was designed to be acted on. The organisations that get retention value from it are not the ones with the highest score. They are the ones who know who makes up the score, why, and what they are doing about it before those people leave.
That takes three things: feedback joined to the person who gave it, drivers that explain the score, and the evidence delivered to the people who can act on it. Do those and the September surprise stops happening.
That’s what SmartCX is built for: individual-level feedback, ranked drivers, and retention signals sent to your CRM, your ticketing tool and your dashboards while there is still time to act. See how it works in our product tour.
Frequently asked questions
Does NPS predict churn?
As a company-wide number, weakly. Individually, tracked over time and read alongside the reasons people gave and their behaviour, it is a useful leading indicator. A falling score with a named driver and a renewal date approaching is about as clear a warning as retention data gets.
Why do promoters still churn?
Because loyalty and staying are not the same thing. Promoters leave when budgets are cut, when they move, when a competitor turns up. NPS predicts experience-driven churn, not every kind of churn, which is why it should sit alongside purchase and usage data rather than replace them.
Which NPS segment is the biggest retention risk?
Passives, usually. Detractors have told you they are unhappy, so you can act. Passives are satisfied enough not to complain and not loyal enough to stay when a competitor calls. They are typically the largest segment and the least studied.
How do you calculate revenue at risk from NPS?
Multiply detractors by their average annual value and their historical churn rate, then widen the estimate to everyone exposed to the same driver.
How quickly should a detractor score be followed up?
Within a day for your most valuable customers, and always with the comment in front of whoever makes the call. The point of the follow-up is to fix the specific thing they raised, not to apologise in general.
SmartCX is the VoC platform that helps you turn feedback data into CX intelligence the whole business can act on. Watch the product tour or talk to us about spotting churn while there is still time to stop it.