
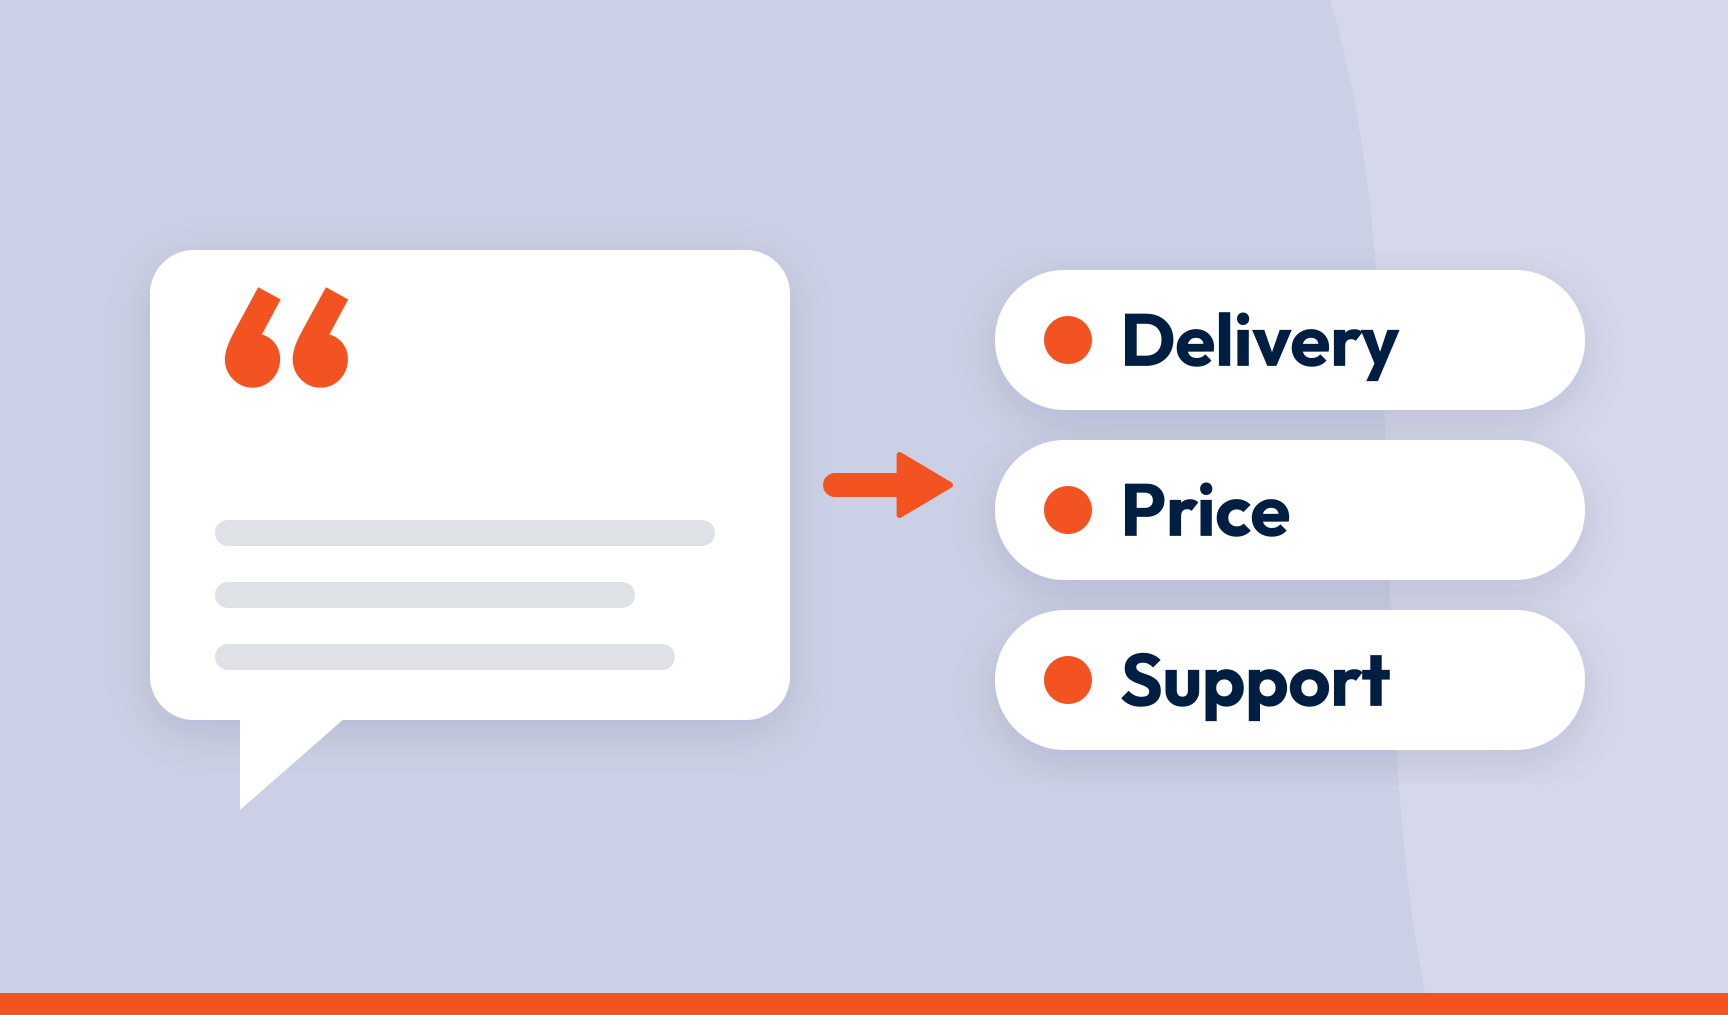
To categorise NPS open-text responses at scale, split each comment into the things the customer actually mentioned, score the sentiment of each mention, assign every mention to exactly one topic, and rank topics by how much they move the score. The method matters less than the test it has to pass: can you drill from any topic straight down to the words a customer wrote?
Key takeaways
- The score tells you what customers think. The verbatims tell you why, and nobody can act on a why they haven’t read
- One mention, one topic. Tagging whole comments to several themes feels thorough and quietly double-counts everything
- Sentiment belongs at phrase level, because ‘great product, useless support’ is not neutral
- Topics should mean the same thing whether the comment came from a survey, a complaint or a review
- A theme you can’t trace to real comments is an opinion with a percentage on it
Your NPS dropped three points. Leadership wants to know why. You have 4,000 comments in a spreadsheet, a word cloud with ‘service’ in the middle, and a meeting at two.
The number tells you something moved. The comments tell you what. Without a systematic way to categorise them, the answer stays buried in column F. Here is how to get it out, and how to make sure nobody in the room can dismiss it.
Why the comments matter more than the score
Categorising NPS open-text responses means grouping what customers said by topic and sentiment to explain the number. You split feedback by promoters (9 to 10), passives (7 to 8) and detractors (0 to 6), then see what each group is talking about, so you can tell what drives loyalty and what drives people out the door.
A score with no verbatims is a thermometer. It tells you the patient is warm. The comments are the diagnosis, and diagnosis is the only part you can act on.
There’s another reason the comments matter. They are a sample. People complain quickly and compliment slowly. A customer who takes the time to praise an experience is standing in for a lot of people who felt the same and said nothing. And every detractor who wrote about a billing error stands for several who hit it and quietly left. Reading the comments properly is how you estimate the size of the silent group, not just the vocal one.
What you need before you categorise anything
Scores, comments and the link between them
Every score needs a follow-up question. ‘What’s the main reason for your score?’ is enough. Collect the number without the words and you have measured a mood and learned nothing about the cause.
Keep each response as one record with a persistent ID, the score, the comment and the journey stage it came from. That link is what lets you say ‘detractors at the delivery stage are talking about X’, which is a sentence you can act on.
Feedback from across the journey
A comment after onboarding and a comment after a support call are about different things. Collect feedback at each stage of the journey and categorisation tells you not just what the problem is but where it lives. One annual relationship survey cannot do that.
Four ways to categorise NPS verbatims
| Method | Best for | Where it breaks |
|---|---|---|
| Manual tagging | A few hundred comments, getting a first feel for the data | Slow, and two analysts will file the same comment differently |
| Keyword rules | Known, predictable themes | ‘Shipping was great’ and ‘shipping was NOT the issue’ both match ‘shipping’ |
| Machine learning classifier | Large volumes with labelled examples | Needs training data to start, drifts over time |
| Unsupervised topic discovery | High volume, messy language, many sources | Only as good as your ability to check it |
Reading 200 comments yourself is still the best way to learn what your customers talk about. It is also the point at which you should stop relying on it, because at 4,000 comments a quarter, consistency collapses. Two people file the same comment in two different places and the trend line starts lying.
Unsupervised discovery finds the topics in the data rather than the ones you thought of in advance. That is its strength: it catches the driver you didn’t predict. The condition is in the last column. Discovered topics are only useful if you can pull one apart and see the customers underneath.
What categorisation you can trust looks like
Automation is not the risk. Unverifiable automation is. Whatever method you use, hold it to five tests.
Traceable. Every topic count should drill down to the actual comments behind it. When someone asks ‘how do you know?’, the answer is a list of what customers said, not a confidence score.
Consistent. The same comment gets the same topic and sentiment every time, and the same topic means the same thing whether it arrived by survey, complaint form or app store review. Categorise sources separately and you get three versions of the truth. Re-run the analysis and watch the themes shuffle and you cannot measure movement, which is the whole point.
Exclusive. One mention, one topic. ‘Great product but support was slow’ is two mentions, each filed once. The comment as a whole is not tagged ‘product’ and ‘support’. Multi-tagging whole comments feels thorough and quietly double-counts: volumes stop adding up, one unhappy customer appears in four themes, and finance stops believing the percentages.
Phrase-level. Sentiment scored per mention, not per response. ‘Love the product, hate the invoicing’ is a positive product mention and a negative billing mention. Averaged to one score per comment, it becomes neutral, and neutral is a lie.
Auditable. Someone outside the CX team can check the work. If the only defence of a theme is ‘the AI said so’, you have replaced one black box with a shinier one.
None of these tests is about which algorithm you use. They are about whether a sceptical colleague can pick a theme apart and find real customers at the bottom of it.
The drill-down: from topic to verbatim
Here is what the whole exercise is for. Not a chart of topics. A path.
Score → topic → sub-topic → the actual comments.
NPS is down three. The biggest negative movement is in ‘Support’. Inside that, ‘Wait times’ has doubled. Click through and there are 140 detractors saying some version of ‘nobody called me back’. Now you are looking at a callback process, not a satisfaction problem, and you can hand the 140 comments to the person who owns it.
Every level of that path has to be one click from the next. Export a spreadsheet to see the comments and the number has already lost the room.
Analysing categorised feedback by segment
Promoters versus detractors
Compare the topics each group talks about. Detractors cluster on support wait times. Promoters keep mentioning ease of use. That contrast is what drives loyalty versus what drives churn, in two columns.
And read the promoter column properly. It tells you what to protect and what to do more of, and for the same reason complaints over-report, praise under-reports.
By customer value and journey stage
An onboarding complaint from a high-value account is a fire. The same complaint from a trial user might be a note. Layer revenue tier, tenure and journey stage onto the topics and priority sorts itself out.
Over time
Watch topic volume and topic sentiment move week to week. A 300% jump in ‘checkout errors’ this week is not a trend, it’s an alarm. Trend lines on topics, not just on the headline score, are how you catch a problem before it reaches the NPS.
From topics to root cause
Rank topics by impact, not volume
The loudest topic is not always the one moving your score. Weight each topic by volume and sentiment together. Lots of strongly negative mentions outrank more mentions that are mildly grumpy. That ranking is your key driver analysis: the shortlist of things that would actually move the number if fixed.
Ask why until you hit a process
‘Why are detractors unhappy?’ Support. ‘Why?’ Wait times. ‘Why?’ Tickets sit unassigned overnight. Now you have a process to change instead of a theme to worry about.
Route it to the owner
A ranked driver is an action only if it lands with the team that can act. Send the support driver to the support lead with the comments attached. Put the topic trend in the dashboard operations already looks at, or in Power BI next to complaint volume and churn. That is the difference between a list of topics and CX intelligence: the same categorised feedback, delivered to the people who can do something about it.
Best practices for categorising NPS feedback at scale
- Audit a sample every month. Pull 50 categorised mentions and check them by hand. It takes an hour and it is your defence when the numbers are challenged
- Connect topics to business metrics. A rise in delivery complaints alongside a rise in churn on that cohort turns anecdote into evidence
- Give every topic an owner. A topic nobody owns is a topic nobody fixes
From verbatims to action
Categorisation is a bridge. On one side, 4,000 comments nobody has read. On the other, a ranked list of drivers with owners, and a promoter column telling you what not to break.
The teams that get value from NPS aren’t the ones with the cleverest model. They are the ones who can stand in front of a sceptic, point at a theme, and show the customers underneath it. It is also how you prove impact later: the driver you fixed, and the comments that stopped arriving.
That’s the approach SmartCX takes: mention-level categorisation you can trace to the words, consistent across every source, ranked into drivers, sent to the teams who own them. See the drill-down working on real feedback in our product tour.
Frequently asked questions
Can one NPS response belong to more than one category?
A response can contain several mentions, and each mention belongs to exactly one topic. Tagging a whole comment to multiple topics double-counts customers and breaks your volume figures. Split the comment, not the count.
Should sentiment be scored per response or per phrase?
Per phrase. A single comment can be positive about the product and negative about billing. Scoring the whole response as one number averages that into a meaningless neutral. Phrase-level sentiment then rolls up to a topic score that reflects both how many people mentioned it and how strongly they felt.
How do you check automated categorisation is accurate?
Sample regularly and read the comments behind the topics. A trustworthy categorisation is traceable to verbatims, consistent when re-run and across sources, exclusive at mention level, and auditable by someone outside the CX team. If any of those fails, fix it before you report a trend.
Why does consistency across data sources matter?
Because your customers don’t care which channel they used. A complaint about wait times in a survey, a review and a support transcript is one problem. If each source is categorised with its own labels, you get three smaller numbers instead of one true one, and the trend disappears into the gaps.
SmartCX is the VoC platform that helps you turn feedback data into CX intelligence the whole business can act on. Watch the product tour or talk to us about categorising your open-text feedback in a way you can defend.