
Ask a CX team for its metrics and you’ll get a long list. Ask which of them would change a decision if it moved, and the list gets shorter.
Customer experience ROI metrics are the measures used to track whether improvements in customer experience are translating into business value. They include perception scores such as NPS, CSAT and CES, alongside behavioural and operational measures such as retention, repeat contacts and cost to serve. A useful set is small, consistent and tracked against a baseline.
Key takeaways
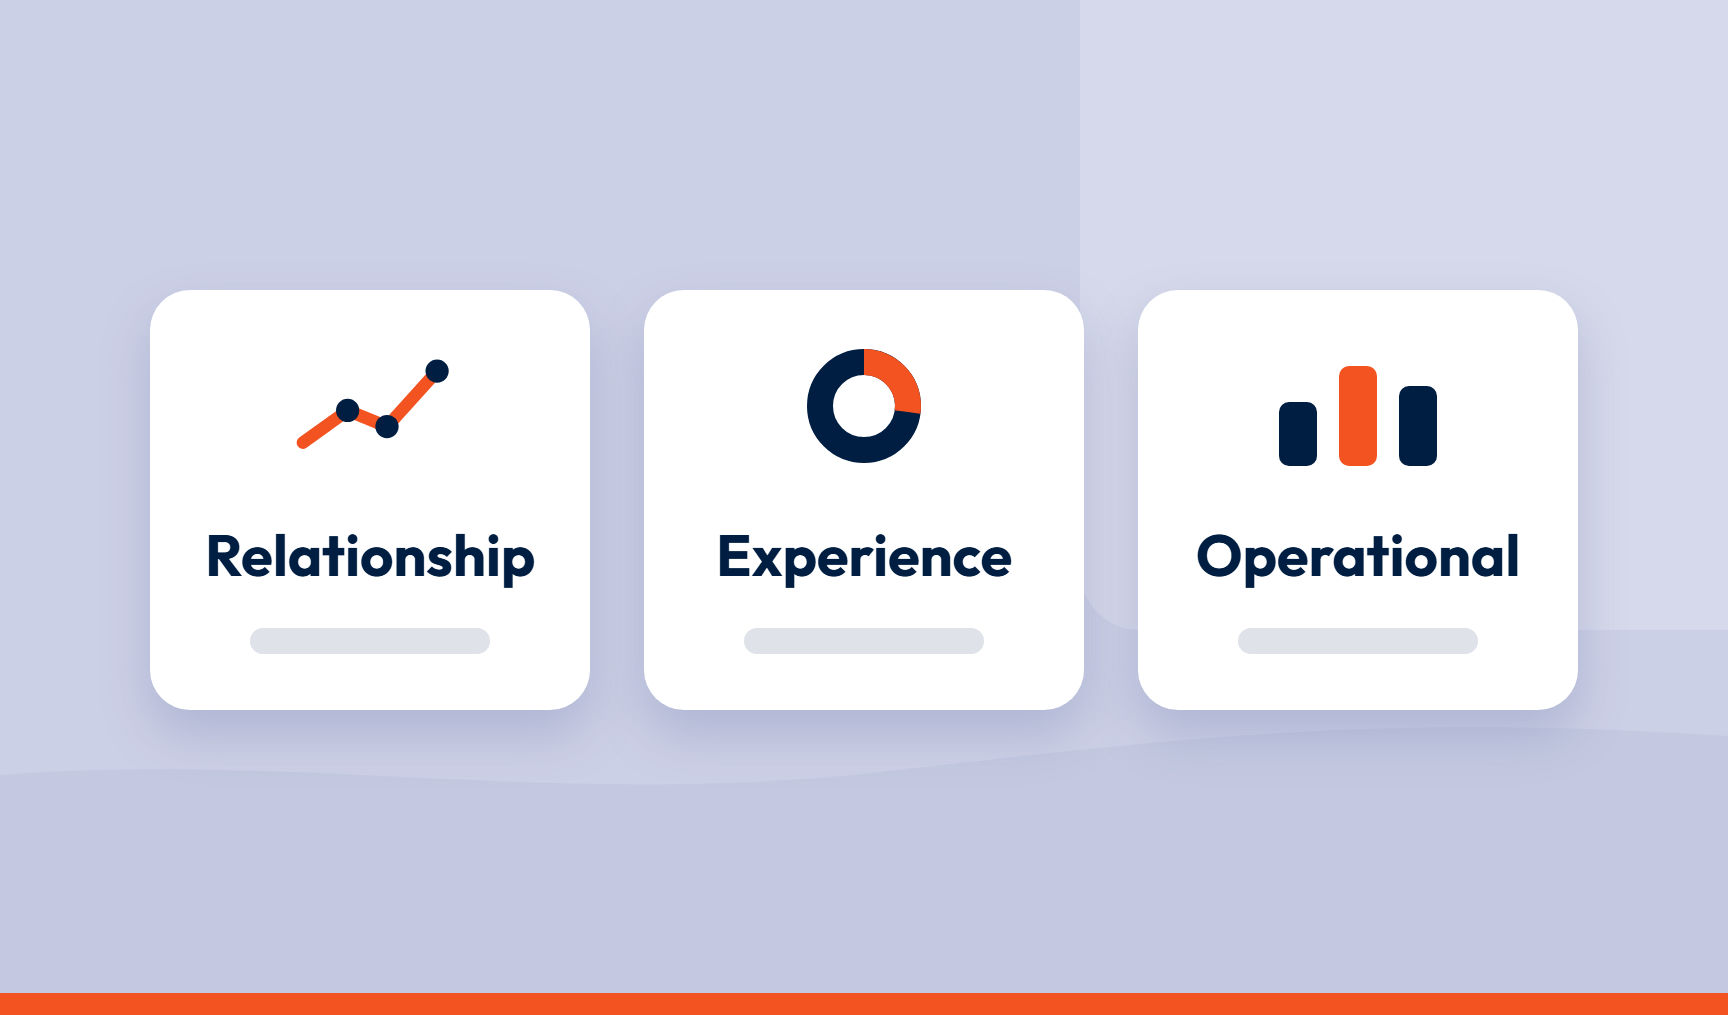
- CX ROI metrics fall into three families: relationship and value, experience, and operational and behavioural.
- Each metric should sit beside the business outcome it’s meant to influence.
- Perception scores are a leading indicator. Business outcomes show whether the signal translated into value.
- A good scorecard is a small, stable set of measures, each with an owner.
- Tracking against a baseline with fixed definitions makes movement easier to interpret.
- Scores show where something is happening. Consistent topics and sentiment, traceable to the verbatim, show why.
A standing set, not a one-off sum
Calculating the ROI of one initiative gives you a number for a particular change and period. How to calculate customer experience ROI covers that. A measurement programme gives you the continuous view: whether experience and business performance are improving, deteriorating or holding steady.
It also supplies the before-and-after inputs the calculation needs. A fall in customer effort might look encouraging, but if repeat contacts and cost to serve aren’t changing, there’s a question to answer. Not every metric belongs in an ROI sum. The set exists to give you enough context to see whether improvements are reaching the business.
The three metric families
There’s no universal list. The right set depends on what your organisation is trying to improve and which outcomes matter commercially. Three families are a useful starting point.
| Family | Examples | What it shows | Potential business outcome |
|---|---|---|---|
| Relationship and value | NPS, customer lifetime value (CLV) | The health and worth of the customer relationship | Retained revenue, referrals, customer value |
| Experience | CSAT, CES | How customers found a particular interaction or journey | Repeat contacts, retention, loyalty |
| Operational and behavioural | First-contact resolution (FCR), time to resolve, repeat contacts, churn, retention, cost to serve | What customers do and what the experience costs | Efficiency, lower cost to serve, retained revenue |
NPS and customer value
NPS gives a view of the relationship customers have with you. Customer lifetime value looks at the economic worth of that relationship. Compare the two by segment or cohort and you can see whether stronger loyalty goes with more renewals or higher spend. That’s a relationship worth investigating, though it doesn’t show the score caused the value.
CSAT and CES
CSAT asks how satisfied a customer was with an experience. CES asks how hard it was to get something done. Both work best close to the moment.
Take a guest who contacts a hotel about a problem with a booking. A high CSAT score after the fix suggests recovery worked. A poor effort score tells a different story if the guest had to call several times to get there. Look only at the blended average, though, and you could easily miss the problem.
Operational and behavioural measures
First-contact resolution, time to resolve and repeat contacts show friction in the service operation. Churn and retention show what customers did afterwards, and cost to serve puts a price on the experience. Read them beside the perception scores. If CES is falling while repeat contacts are rising, you’re likely seeing the same problem from two angles.
Scores are a leading indicator
A change in CES can be an early sign that an experience is improving. Retention or customer value may take much longer to move, with other factors in between. The link between any metric and any outcome must be established in your own data, and how to prove customer experience drives revenue shows how.
Scores tell you where. Feedback tells you why.
Let’s say CSAT drops for one journey. The score points at the problem. It doesn’t say whether customers are frustrated by delivery times, communication or pricing. Open-text feedback does, once it can be measured consistently.
SmartCX does that in three ways:
- Automatic topic discovery. Topics are discovered automatically from the feedback itself.
- Consistency across sources. Surveys, reviews, support tickets and social are classified the same way, so “billing” means the same thing everywhere.
- Phrase-level sentiment. A comment that praises the driver and criticises the delivery window is positive and negative at once, and phrase-level scoring keeps both rather than averaging them to neutral.
Every score and topic drills down to the verbatim behind it. When someone asks why a number moved, you can show what customers were saying when it did.
Building a scorecard
A useful scorecard is small and stable, and every metric on it has a reason to be there. Four principles do most of the work:
- Start with a few. One or two measures from each family is usually enough.
- Put the business outcome beside each score, using finance and CRM data.
- Segment rather than average. A healthy overall figure can hide a customer group or journey stage that’s struggling.
- Give each measure an owner and a decision it informs. If nobody knows what a metric would change, it probably doesn’t belong.
An illustrative scorecard for a subscription business:
| Metric | What to watch | Outcome alongside it |
|---|---|---|
| NPS by customer segment | Movement in relationship strength | Renewal, referrals, customer value |
| CES after support interactions | How easily issues get resolved | Repeat contacts, cost to serve |
| Complaint topic volume and sentiment | Changes in recurring issues | Cancellations, retention |
| First-contact resolution | Issues fixed without further contact | Cost to serve |
Tracking movement against a baseline
A metric becomes useful when you can interpret its movement, and that starts with a baseline. Before you make a change, establish where the relevant measure sits. Then track what happens afterwards using the same definitions and approach.
That consistency is easy to break. Change the wording of a question, the scale, the way feedback is categorised or the group being measured, and the trend becomes hard to read. The movement then reflects your method more than your customers.
Compare like with like where you can: the same segment, journey, channel and period. Otherwise, seasonal swings can look like the effect of an initiative. Mark when significant changes launched too. If a new process went live in April and a complaint topic began falling in May, you have something concrete to investigate.
Perception measures often move before behavioural and financial ones, which is why a single before-and-after figure can mislead. SmartCX dashboards show movement over time, which is how teams track score improvement rather than reporting a snapshot.
What you can do right now
List the metrics you report today. Next to each, write the outcome it should move and who owns it. Any row you can’t fill in is a candidate to fix or drop.
How SmartCX helps
For CX leaders and managers who need to turn scattered feedback into decisions the business acts on, SmartCX gives every team one trusted data foundation for every dashboard, decision, action and AI workflow.
SmartCX brings feedback from surveys, reviews, support tickets and social into one place, including CSAT, NPS and CES surveys run at every touchpoint. It structures that feedback into consistent topics, adds sentiment analysis, and lets teams drill from the analysis back to the underlying verbatim.
For teams tracking CX performance over time, that means the scorecard measures are supported by a consistent view of what customers are actually saying. Its Power BI integration brings those measures alongside the wider business data. See it in a product tour.
Frequently asked questions
Which CX metrics should I start with?
Start with one or two measures from each of three families: relationship and value (such as NPS), experience (CSAT or CES) and operational and behavioural (such as first-contact resolution, repeat contacts or retention). Choose those with a clear link to an outcome you care about.
How do CX metrics link to business outcomes?
Each family connects to different outcomes. Relationship measures link to referrals and customer value. Experience measures link to repeat contacts and loyalty. Operational and behavioural measures link to cost to serve and retained revenue. The strength of each link must be shown in your own customer and business data.
What should a CX scorecard include?
A small, stable set of measures drawn from the three families. Each should have the outcome it could influence, an owner and a decision it informs. Add the topics and sentiment behind the scores so the numbers come with reasons.
Why is a baseline important in CX measurement?
A baseline is the reference point that shows whether something has changed. Without one, it’s hard to tell genuine movement from normal variation or from a change in how data was collected or analysed.
How often should I review CX metrics?
Match the cadence to how quickly each metric moves and how often you can act on it. For example, operational measures may suit monthly review and relationship measures quarterly. What matters is a consistent rhythm rather than a one-off exercise.
Want to see how it works? Watch a tour or talk to us.