Blog
All articles
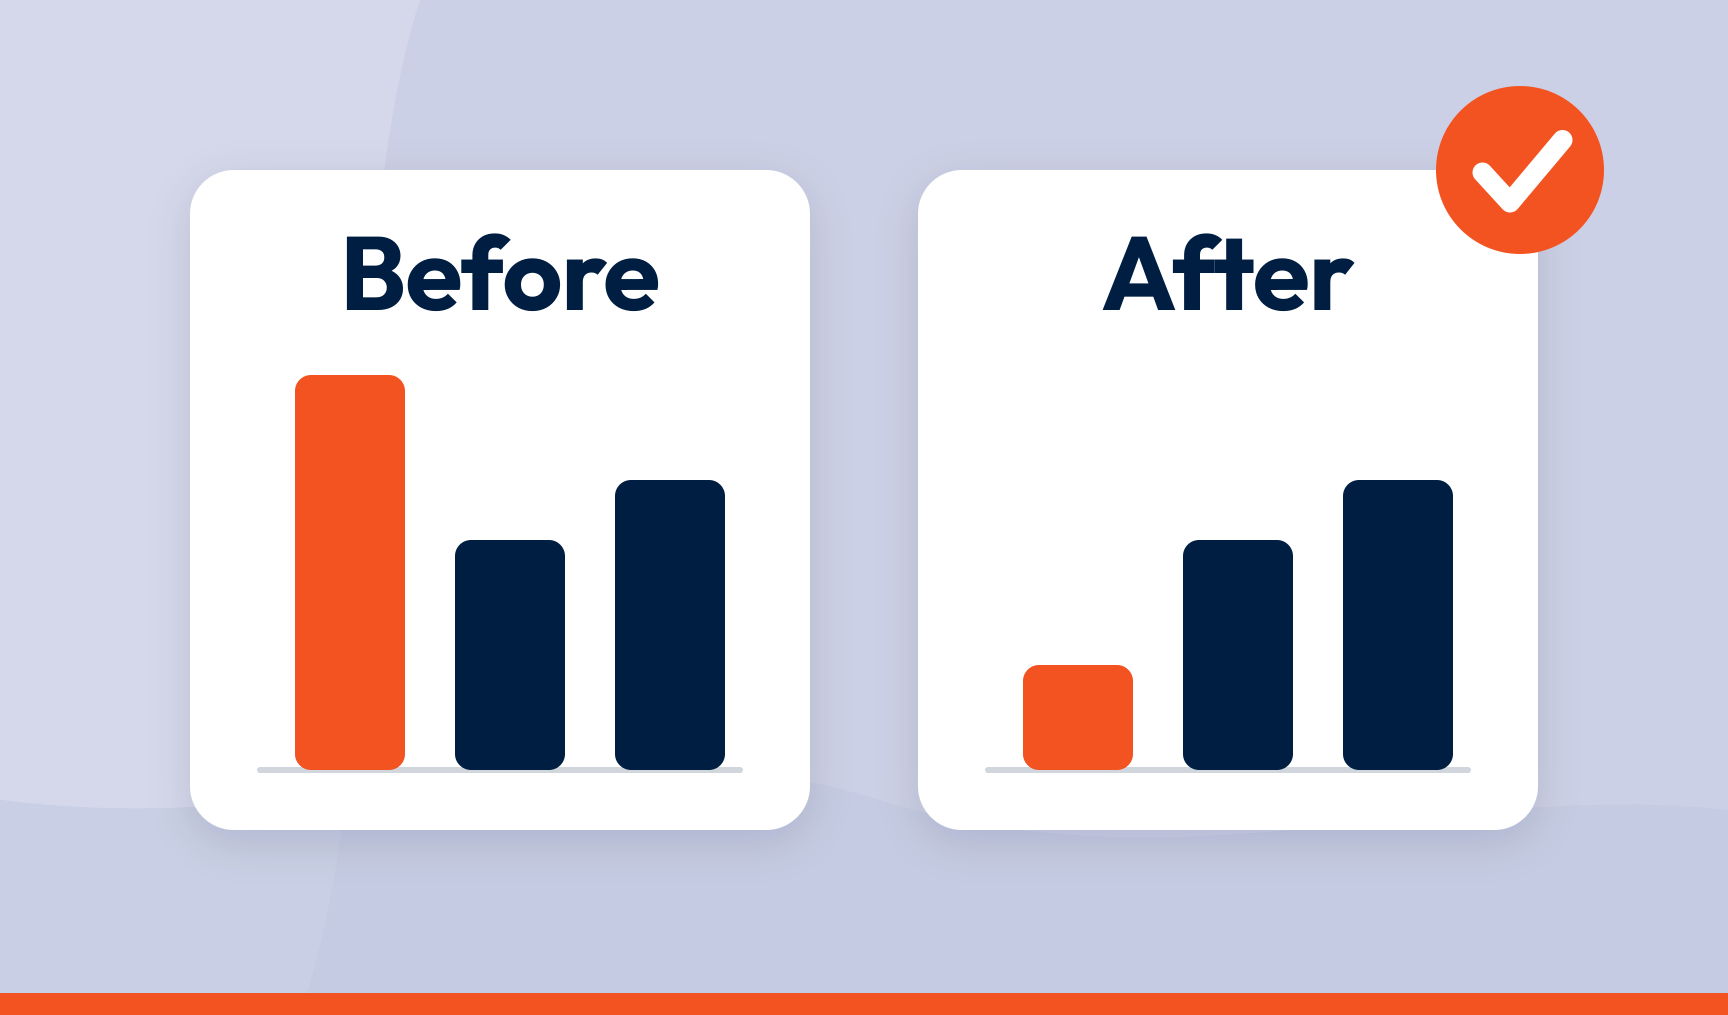
How to prove a CX fix actually worked
Set a baseline before you change anything, track the same topic the same way afterwards, and look for three things moving together.

How to increase customer lifetime value with feedback
Act on feedback fast enough that unhappy customers stay and happy customers get more of what they liked, then measure the effect on lifetime value.
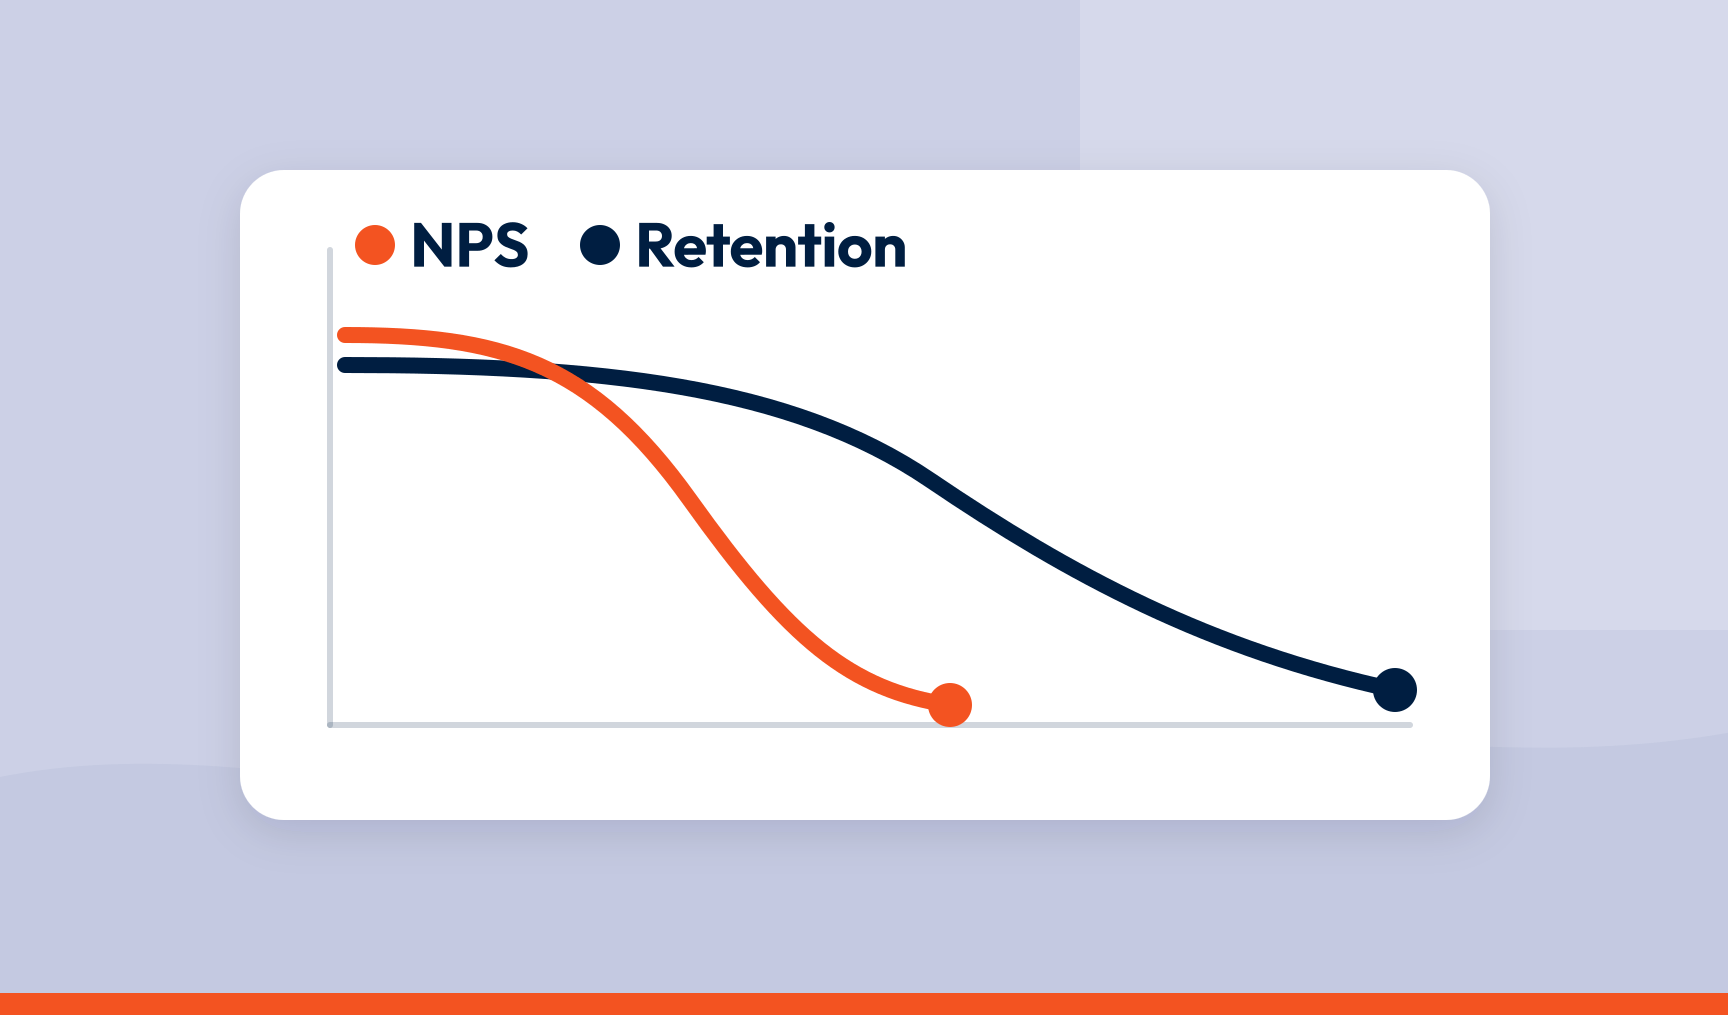
Connecting NPS to retention: a framework that predicts churn before it happens
A company-wide score cannot predict churn. A score joined to the customer record and the reason they gave can, and that is a warning you can act on.
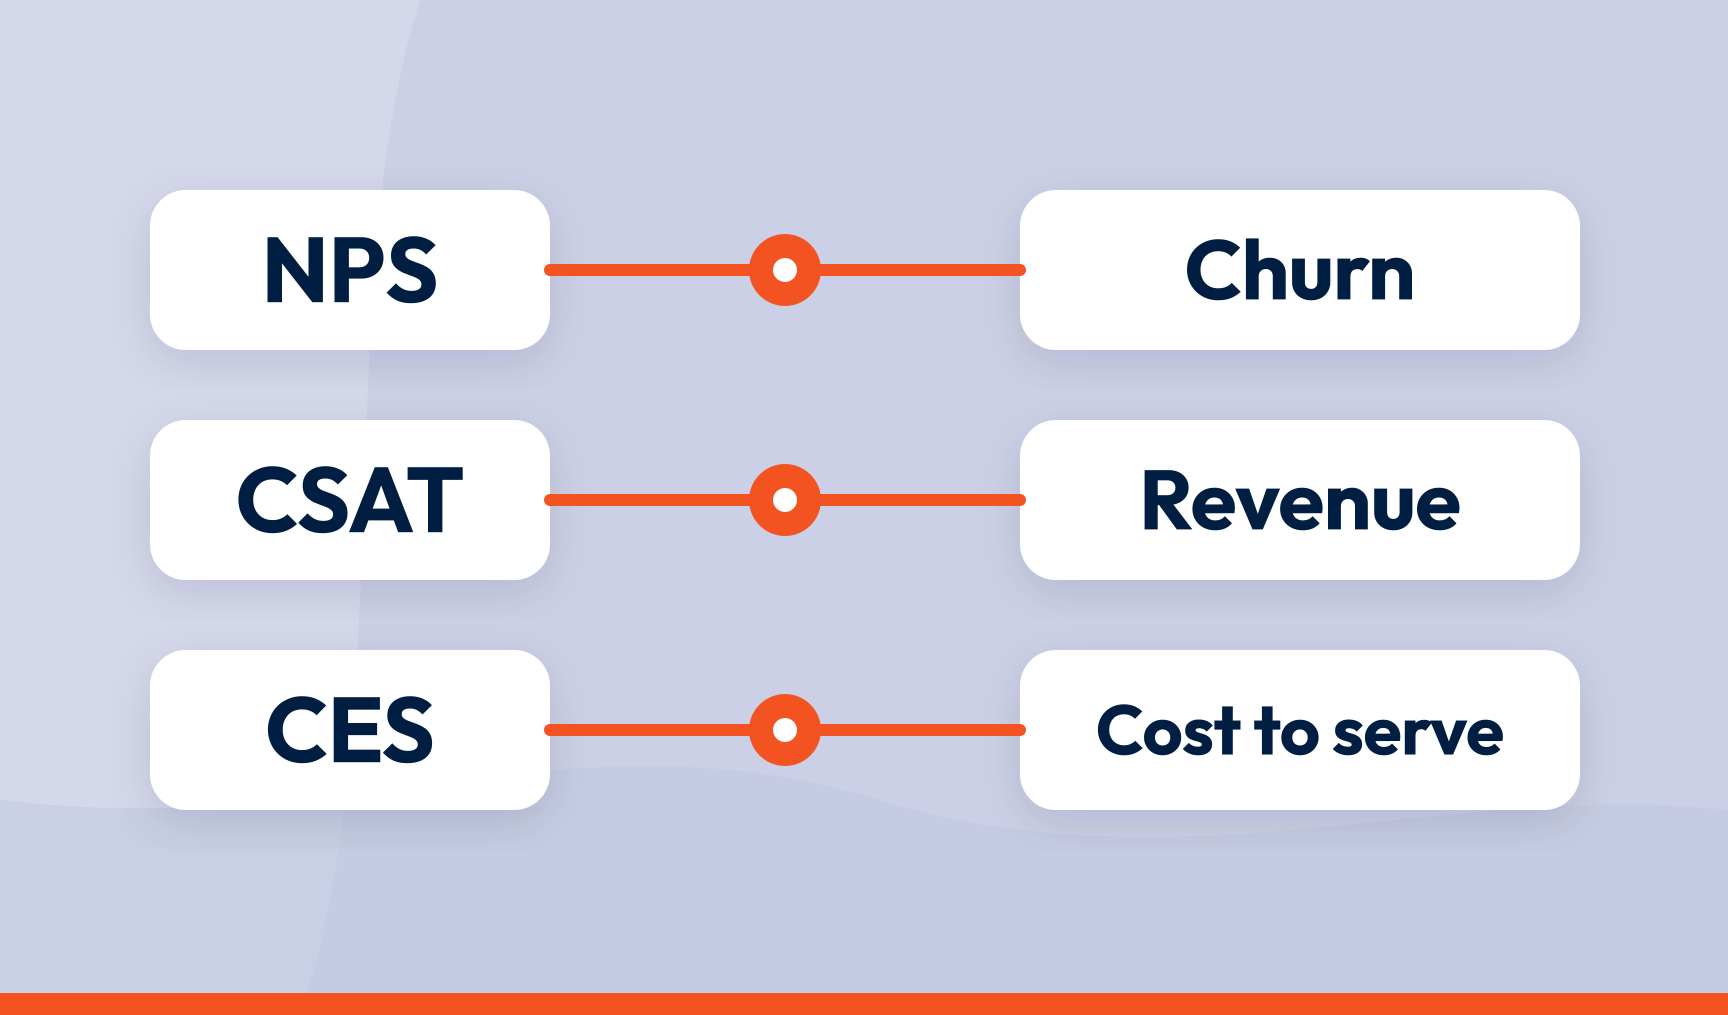
How to tie customer experience scores to business KPIs
Connect each response to the customer record behind it, find which drivers move the score, and report the CX score and the business KPI on the same page.

How to categorise NPS open-text responses at scale (without a black box)
Split each comment into what the customer mentioned, score each mention, assign it to one topic and rank topics by how much they move the score.
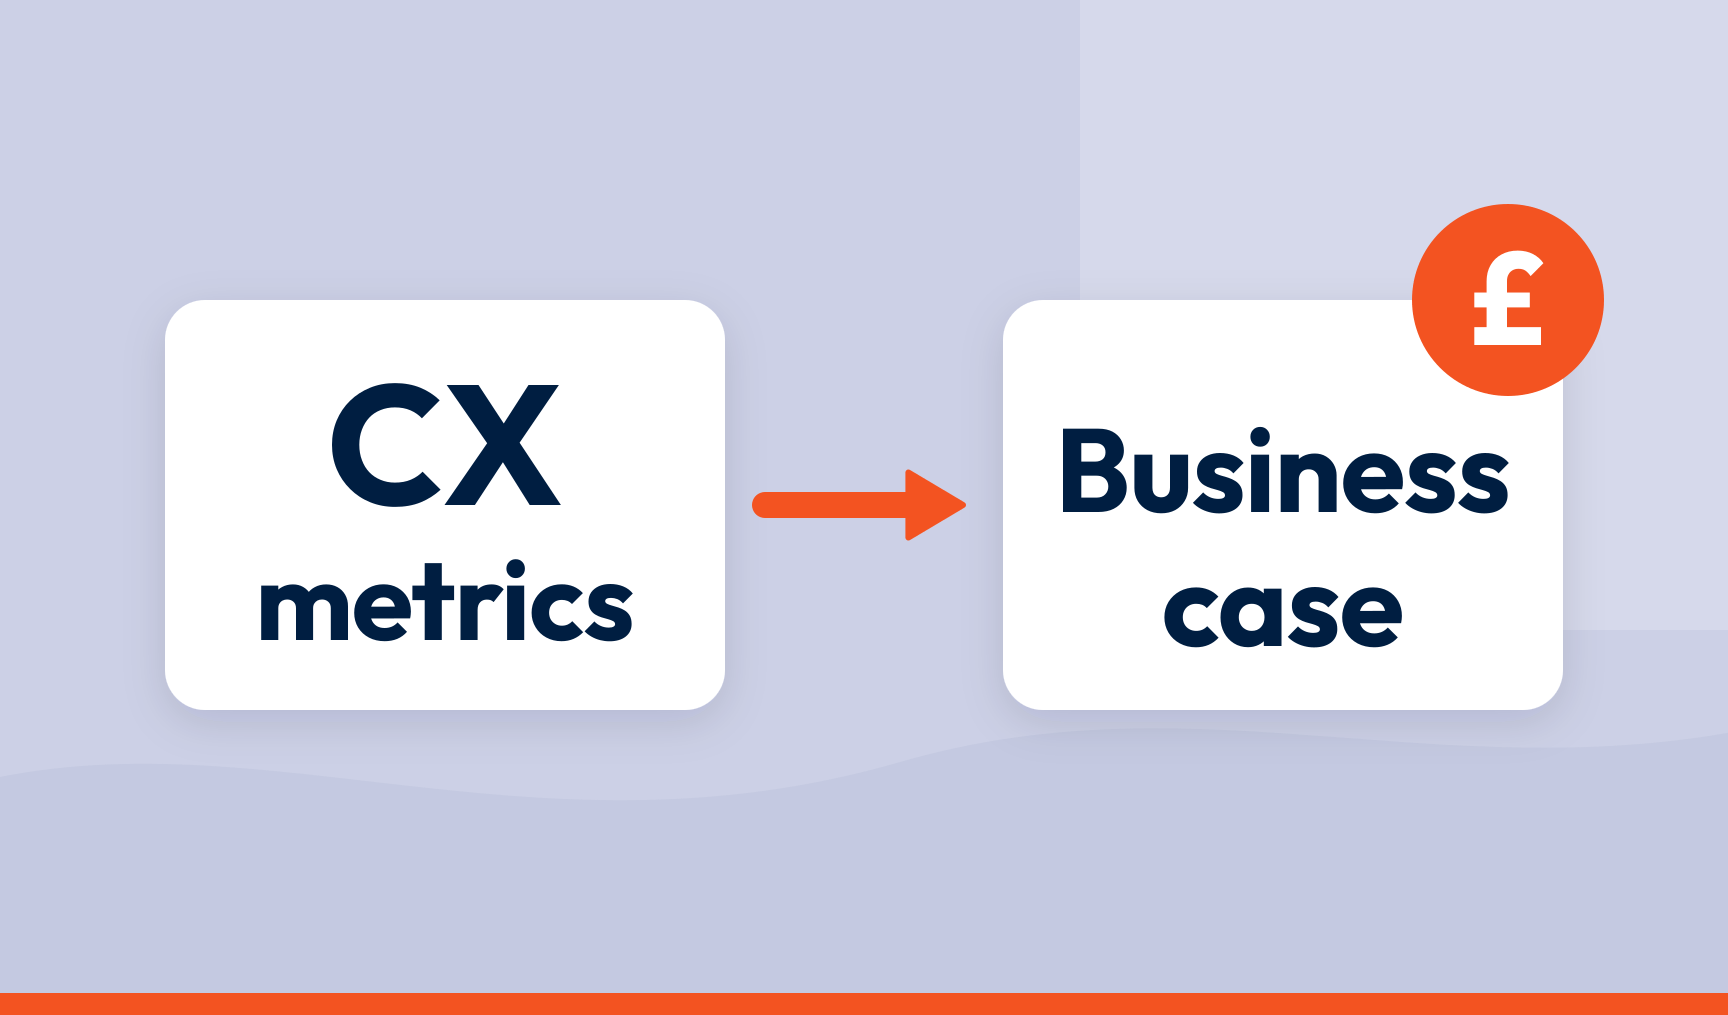
How to turn CX metrics into a business case your CFO will approve
Translate each experience metric into a financial outcome through a clear chain: the score, the driver behind it, and the KPI that driver moves.
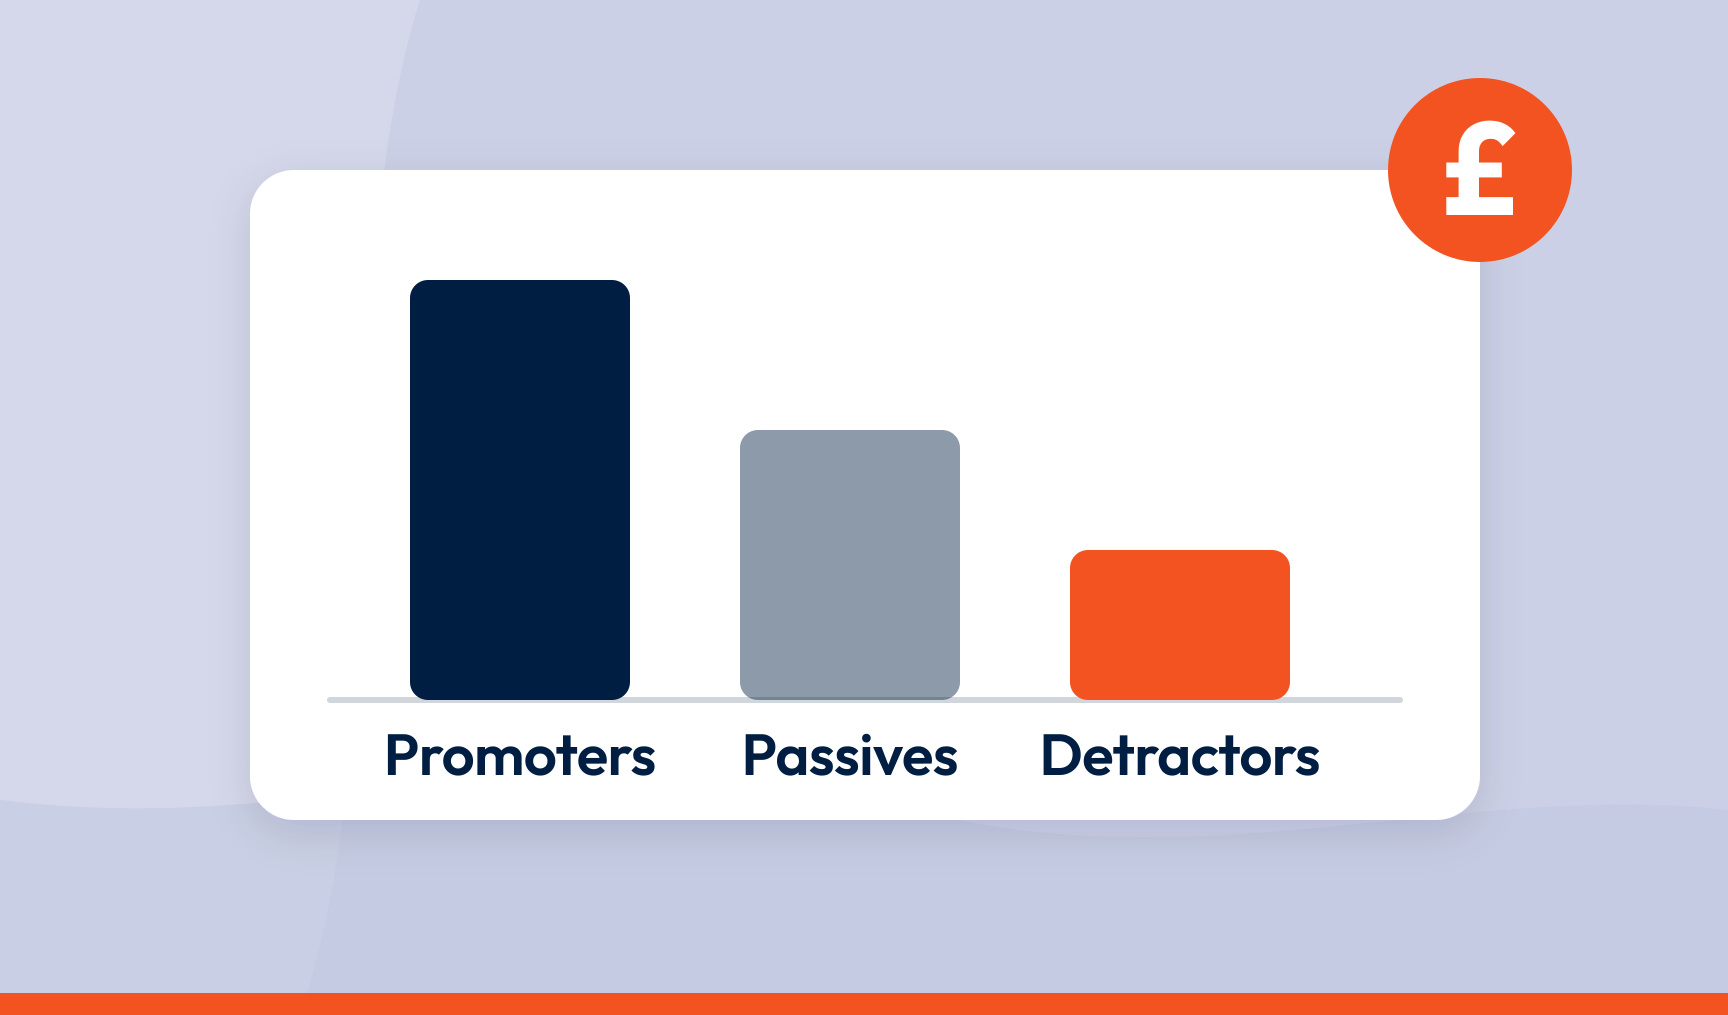
How to calculate the revenue impact of NPS improvements (and why the sum is the easy part)
Promoters, passives and detractors are worth different amounts. Revenue impact is the gap between segments multiplied by the customers who move.

SmartSurvey vs Sprinklr: which feedback platform is right for you?
Sprinklr spans more than 30 products. If all you actually need is feedback, here is how the two compare on survey depth, analysis, channels and price.
Move from scores to outcomes
In the boardroom, the question is rarely what your NPS is. How to treat scores as inputs and connect them to retention, churn and customer lifetime value instead.